Figures & data
Table 1 Transcription Levels of PLXDC1 in Gastric Cancer Subtypes in the Oncomine Database
Figure 1 Expression of PLXDC1 in tumors. (A) The expression of PLXDC1 in pan-cancer in the Oncomine database. Figures represent the number of studies. Red represents high expression. Blue represents low expression. (B) Paired difference analysis and (C) unpaired difference analysis of PLXDC1 expression in tumor tissues and paraneoplastic tissues in TCGA database. (D) Immunohistochemical staining analysis of PLXDC1 expression in gastric cancer. -: No staining in normal paracancerous tissue; +: Weak staining in tumor tissues; ++: Moderate staining in tumor tissues; +++: Strong staining in tumor tissues.
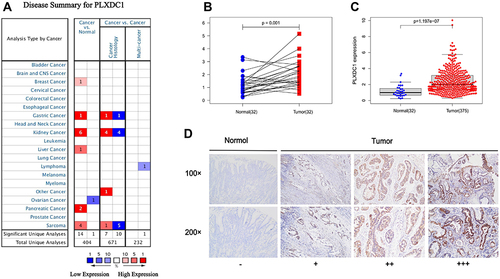
Table 2 Univariate Cox Survival Analysis of PLXDC1 Expression and Clinical Parameters
Figure 2 Prognostic analysis of PLXDC1 in gastric cancer. (A) OS, (B) FP and (C) PPS analysis of PLXDC1 in gastric cancer in the Kaplan-Meier Plotter database. (D) The accuracy of PLXDC1 expression and clinicopathological parameters in univariate Cox analysis for the prediction of gastric cancer prognosis as assessed by using ROC curves. (E) Multivariate Cox survival analysis of PLXDC1 expression and clinicopathological parameters. (F) PLXDC1 integrates clinicopathological parameters to build a nomogram survival prediction system to predict 1-, 3 -and 5-year patient survival. In the nomogram survival prediction system, each clinicopathological parameter of the patient corresponds to a score, and all scores are summed to obtain an overall score for the patient, which predicts the 1-, 3-, and 5-year survival rates for the patient. *P value < 0.05; ***P value < 0.001.
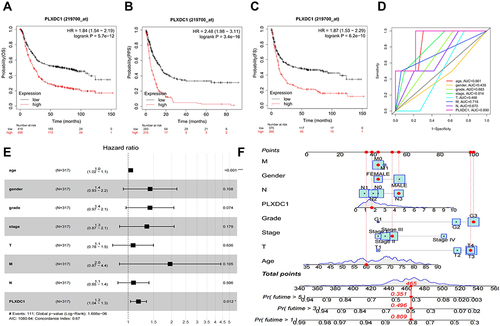
Table 3 Results of PLXDC1 Enrichment Upregulation of GSEA Pathways in Gastric Cancer
Figure 3 GSEA enrichment analysis of PLXDC1 in gastric cancer.
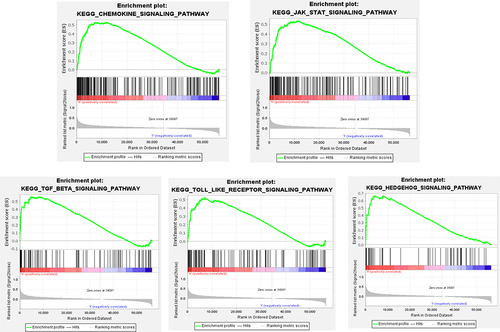
Figure 4 Analysis of the role of PLXDC1 in the TME of gastric cancer. (A) Hallmark pathway gene set enrichment in the high and low PLXDC1 expression groups in gastric cancer. (B) Differential analysis of immune cell infiltration and functional gene sets in gastric cancer in the high and low PLXDC1 expression groups. (C) Differential analysis of stromal activation signaling pathways in gastric cancer in the high and low PLXDC1 expression groups. (D) Differential analysis of immune cell, stroma and ESTIMATE scores in the high and low PLXDC1 expression groups in gastric cancer. (E) Differential analysis of TIDE in high and low PLXDC1 expression groups in gastric cancer. *P value < 0.05; **P value < 0.01; ***P value < 0.001.
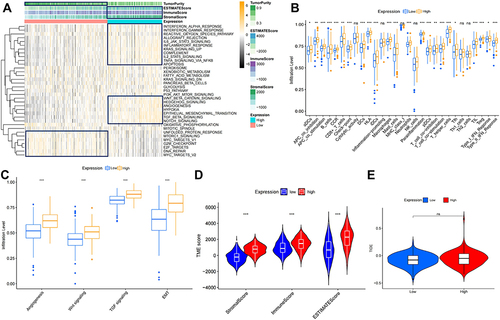
Figure 5 Correlation analysis of PLXDC1 expression and immune cell infiltration in the TME of gastric cancer. (A) Heatmap demonstrating the correlation of PLXDC1 expression with immune cell infiltration in pan-cancer. Red represents positive correlation and blue represents negative correlation. The deeper color indicates the stronger correlation. (B) Correlation analysis of PLXDC1 expression and immune cell infiltration in the TME of gastric cancer. (C) Correlation analysis of PLXDC1 expression and infiltration of immune subtypes in gastric cancer. *P value < 0.05.
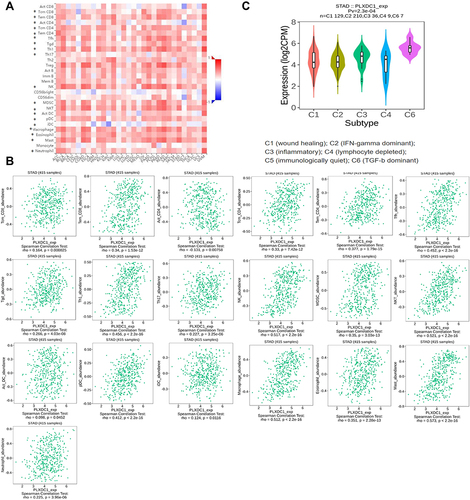
Table 4 Correlations Between the Expression of PLXDC1 and Immunoinhibitors
Table 5 Correlations Between the Expression of PLXDC1 and Immunostimulators
Figure 6 Analysis of immunomodulators associated with PLXDC1 expression in TME of gastric cancer. (A) Analysis of PLXDC1-related protein interactions of 48 immunomodulators. (B) Functional enrichment analysis of 48 immunomodulators whose expression is associated with PLXDC1 expression. Each color of the circles corresponds to a function and the size of the circles indicates the degree of functional enrichment.
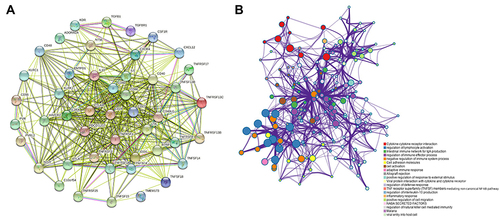
Figure 7 Construction of a PLXDC1-related immune prognostic risk model. (A) Differential analysis of immunomodulators in the high and low PLXDC1 expression groups. (B) Univariate Cox survival analysis of 48 immunomodulators associated with PLXDC1 expression in TME of gastric cancer. (C) Multivariate Cox analysis to screen candidate genes to construct a PLXDC1-associated Cox risk proportional regression model. (D) Distribution of patient samples in the high- and low-risk groups classified by the Cox risk model. (E) Prognostic analysis was performed by dividing patients into high and low risk groups according to the median value of the model risk scores. (F) Accuracy of ROC curve assessment model risk scoring and clinicopathological parameters in the prediction of prognosis. Model risk scoring combined with clinicopathological parameters for (G) univariate Cox and (H) multivariate Cox analyses. (I) TIDE assessment of immune evasion potential in the high- and low-risk groups of the risk model. *P value < 0.05; **P value < 0.01; ***P value < 0.001.
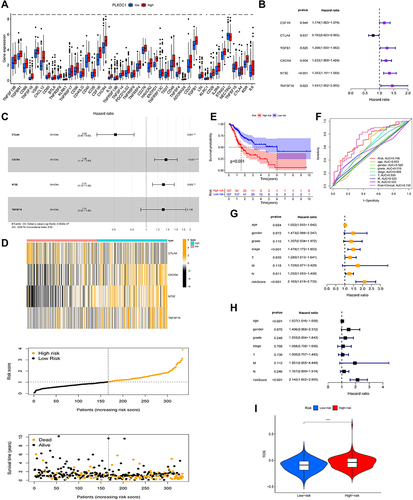
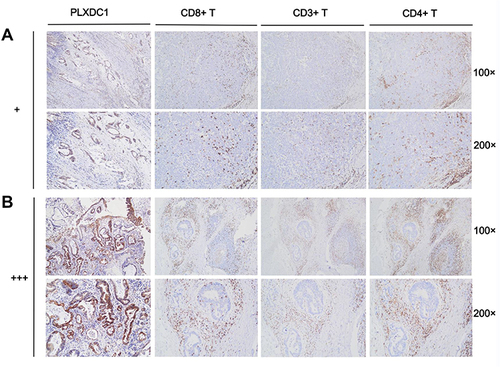
Figure 8 Immune cell infiltration in PLXDC1 high and low expression groups. (A) Infiltration of CD8+ T cells, CD3+ T cells and CD4+ T cells in PLXDC1 high expression group (+). (B) Infiltration of CD8+ T cells, CD3+ T cells and CD4+ T cells in PLXDC1 low expression group (+++).