
Figures & data
Table 1 The Baseline Characteristics of the Subjects
Table 2 Plasma Selenium Levels and Biomarker Index Levels Between Groups
Figure 1 The age and gender of the two groups tended to be balanced after matching, the matching effect was satisfied.
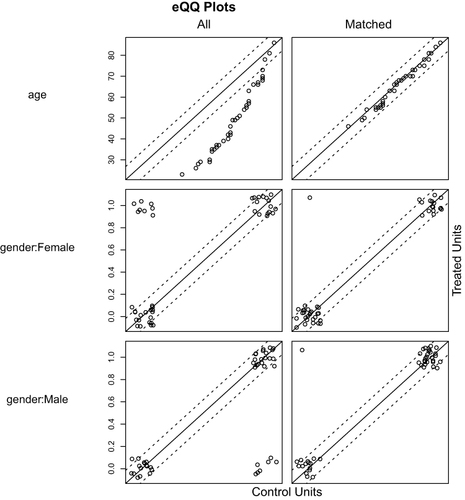
Table 3 Pearson Correlation Coefficient Between Plasma Selenium Level and Other Variables