Figures & data
Figure 1 miRNA-sequences experiment workflow.
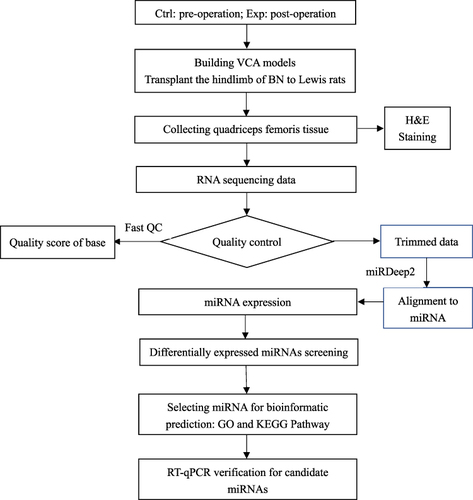
Table 1 Sequences of Primers for RT-qPCR
Figure 2 HE staining of muscle samples. Allograft muscle tissues at days 0 (A), day 3 (B), day 7 (C), day 10 (D) and day 14 (E). Bar; 100 μm.
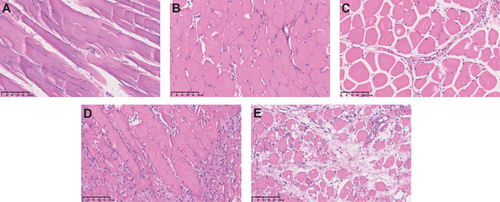
Table 2 Differentially Expressed miRNAs
Figure 3 (A) The hierarchical clustering heatmap for miRNA. The color in the panel represents the relative expression level (log2-transformed). The color scale is show below: blue represents an expression level below the mean, and red represents an expression level above the mean. The colored bar top at the top panel showed the samples group, and the colored bar at the right side of the panel indicated the divisions which were performed using K-means. (B) The scatter plot between two groups for miRNA. The values of X and Y axes in the scatter plot are the averaged CPM values of each group (log2 scaled). miRNAs above the top line (red dots, up-regulation) or below the bottom line (green dots, down-regulation) indicate more than 1.5 fold change between the two compared groups. Gray dots indicate non-differentially expressed miRNAs. (C) The volcano plot of miRNA. The values of X and Y axes in the volcano Plot are log2 transformed fold change and -log10 transformed p-values between the two groups, respectively. (Red: up-regulated; Green: down-regulated). Gray circles indicate non-differentially expressed miRNAs.
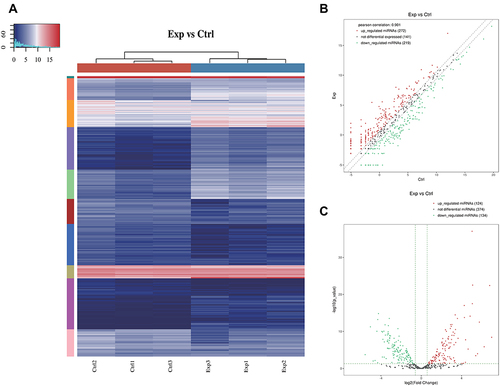
Figure 4 Bioinformatic Prediction. GO (A) and Pathway (C) analysis for up-regulated miRNA. GO (B) and Pathway (D) analysis for down-regulated miRNA.
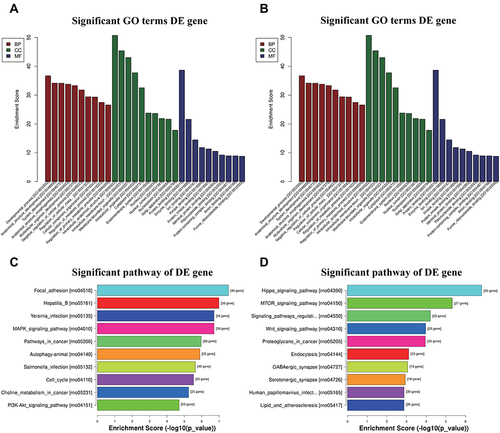
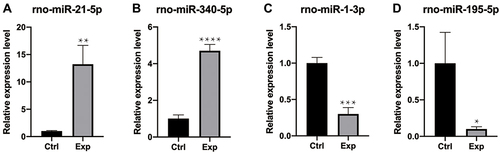
Figure 5 RT-qPCR verification. Compared with the control group (ctrl), (A and B) rno-miR-21-5p and rno-miR-340-5p were up-regulated; (C–D) rno-miR-1-3p and rno-miR-195-5p were down-regulated. The data were normalized using the mean ± standard error of the mean (SEM). *P ≤0.05, **P ≤0.01, ***P ≤0.001, ****P ≤0.0001.