Figures & data
Figure 1 The experimental design and treatment schedule.
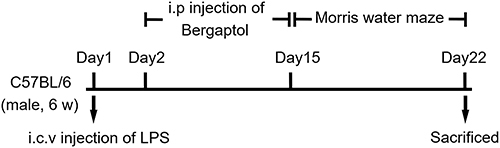
Figure 2 Effect of Bergaptol on LPS-induced cognitive impairment in mice, (A) Representative water maze traces of different groups on day 3. (B) Escape latency analysis. (C) Time spent in the target zone in the probe test. (D) Swimming speed of different groups. The results are expressed as the mean ± SEM (n=8–10). *p < 0.05 and ***p < 0.001 as compared with the LPS group.
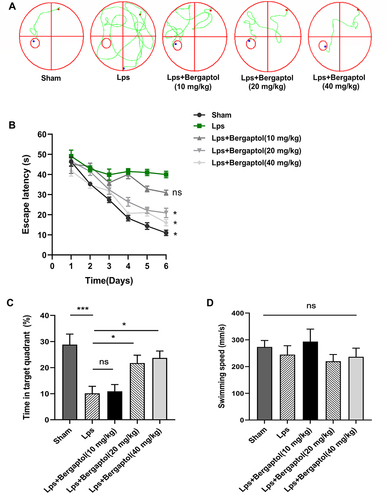
Figure 3 Effects of Bergaptol treatment on the hippocampal CA1 neuron region. (A) Haematoxylin-eosin and (B) Nissl assay of the hippocampal CA1 neuron region of sham mice, LPS mice, and Bergaptol treated LPS mice. Damaged neurons are characterized by cytoplasmic vacuolation, enhanced nuclear basophilia and reduced Nissl bodies (damaged cells indicated by black arrows). Bergaptol treatment significantly reduced the LPS-induced neurological damage in the hippocampusCA1 region. The scale bar was 10 μm. (C) Microscopic photographs of various groups of typical Golgi-stained hippocampal CA1 neuron region. (D) Statistical results of dendrite spine density in each group. The results are expressed as the mean ± SEM (n=4). *P < 0.05, **P < 0.01 as compared with the LPS group.
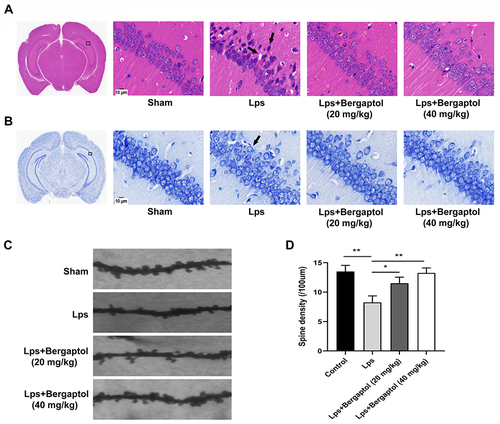
Figure 4 Effects of Bergaptol treatment on synaptic-related proteins. (A) The effect of Bergaptol on synaptic-related proteins in the hippocampus of mice was detected by immunofluorescence staining. The scale bar was 100 μm. (B) Statistical results of immunofluorescence intensity. Bergaptol treatment significantly improved the LPS-induced reduction of PSD-95 and synapsin-1. The results are expressed as mean ± SEM (n=3). *P < 0.05, **P < 0.01 and ***P < 0.001 as compared with the LPS group.
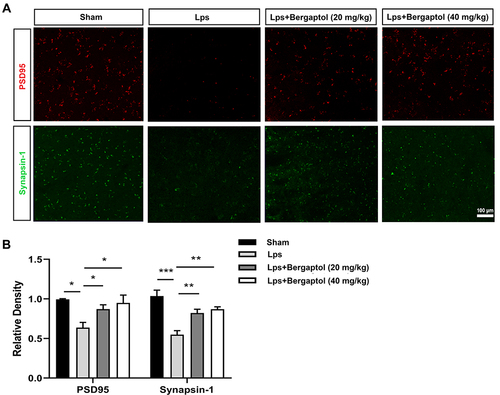
Figure 5 Effects of Bergaptol on proinflammatory cytokine in LPS-treated mice. The mRNA levels of (A) TNF-α, (B) IL-6 and (C) IL-1β in hippocampal tissues of mice in each group. ELISA analysis revealed the release of (D) TNF-α, (E) IL-6, and (F) IL-1β in hippocampal tissues. The results are expressed as mean ± SEM (n=3). *P < 0.05, **P < 0.01, ***P < 0.001 and ****P < 0.0001 as compared with the LPS group.
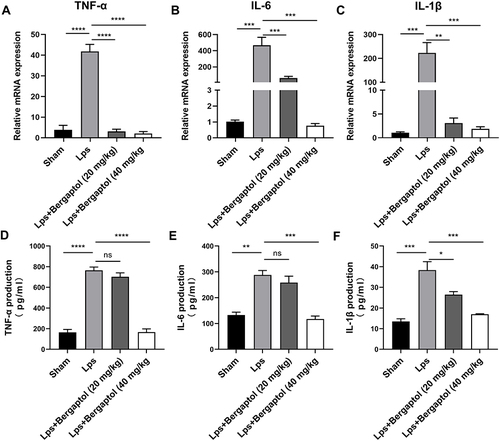
Figure 6 Effects of Bergaptol on LPS-treated mouse hippocampus Iba-1 positive microglia. (A) The effect of Bergaptol on Iba-1 positive microglia was detected by immunofluorescence staining. The scale bar was 100 μm. (B) Statistical results of immunofluorescence. Microglia density is indicated by the number of Iba-1 positive microglia per unit area. The results are expressed as mean ± SEM (n=3). **P < 0.01 and ***P < 0.001 as compared with the LPS group.
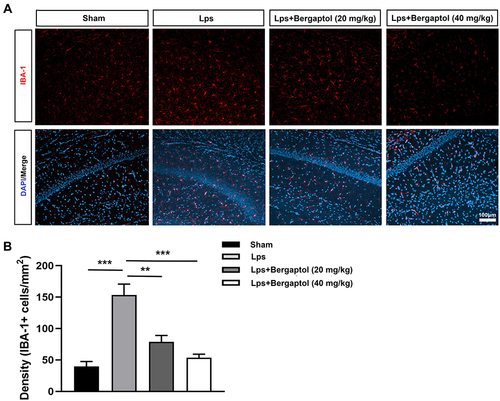
Figure 7 Effects of Bergaptol on the cytotoxicity and inflammatory factor production in the LPS-stimulated BV-2 cells. (A) BV-2 cells were treated with Bergaptol (1, 2, 5, 10, 20, 40, 80 and 160 μg/mL) and cellular activity was measured after 24 hours. (B) Representative Western blotting bands for TNF-α, IL-6, IL-1β and GAPDH of BV-2 cells. (C–E) Quantitative analysis of Western blotting bands and the protein expression level was standardized as GAPDH. The results are expressed as mean ± SEM (n=3). *P < 0.05, **P < 0.01 and ****P < 0.0001 as compared with the LPS group.
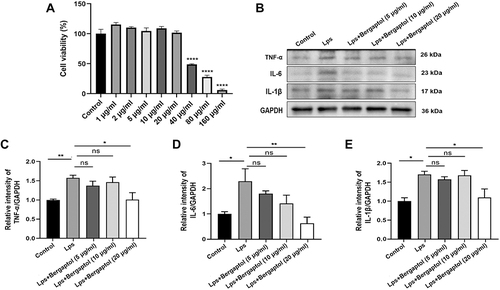
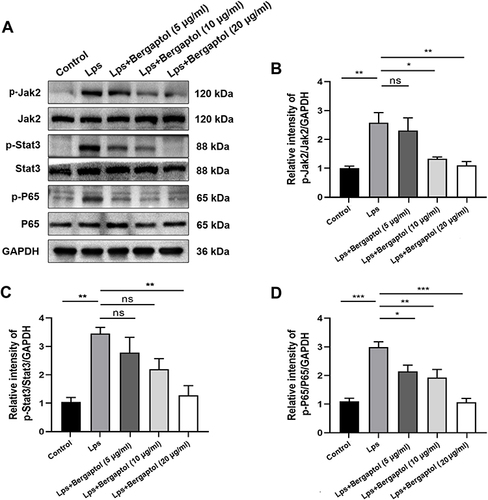
Figure 8 Effects of Bergaptol on LPS-induced JAK2/STAT3/p65 pathway activation in BV-2 cells. (A) Representative Western blotting bands for p-JAK2/JAK2, p-STAT3/STAT3, p-p65/p65 and GAPDH of BV-2 cells. (B–D) Quantitative analysis of Western blotting bands and the protein expression level was standardized as GAPDH. The results are expressed as mean ± SEM (n=3). *P < 0.05, **P < 0.01 and ***P < 0.001 as compared with the LPS group.