Figures & data
Table 1 Primers Used for qRT-PCR
Figure 1 Temporal pattern of the expression and location of Dectin-1 following ICH. (A) Protein bands of temporal expression of Dectin-1 following ICH. (B) Protein quantitative analyses of Dectin-1; n = 4. Data are expressed as the mean ± SEM. *p < 0.05, **p < 0.01, ***p < 0.001 vs sham. (C) Double immunofluorescence staining images of Dectin-1 co-located with microglia (Iba-1), astrocytes (GFAP), and neurons (NeuN) at 3 days following ICH. Nuclei: DAPI; n = 2. Scale bar = 50 μm.
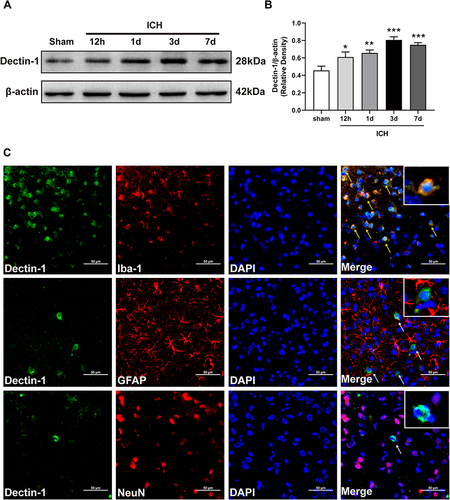
Figure 2 Effects of different doses of laminarin on neurological function and brain edema. (A) Modified Garcia score. (B) Corner turn test. (C) Forelimb placement test. (D) Brain water content at 3 days following ICH; n = 6. Data are expressed as the mean ± SEM. *p < 0.05, ***p < 0.001 vs sham; #p < 0.05, ##p < 0.01, ###p < 0.001 vs ICH + vehicle; &&p < 0.01 vs ICH + laminarin 150 mg/kg.
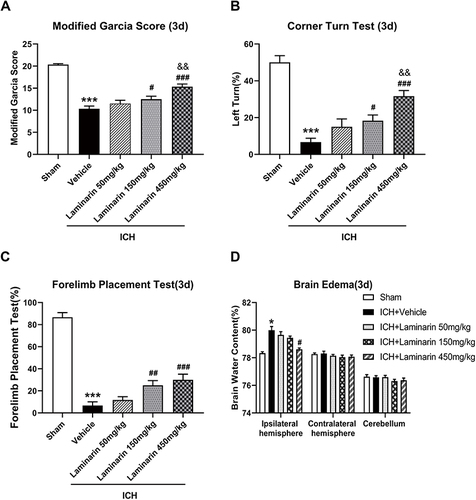
Figure 3 Inhibition of Dectin-1 reduced neurological impairment and brain edema at 7 days following ICH. (A) Modified Garcia score. (B) Corner turn test. (C) Forelimb placement test. (D) Brain water content at 7 days following ICH; n = 6. Data are expressed as the mean ± SEM. ***p < 0.001 vs sham. #p < 0.05, ###p < 0.001 vs ICH + vehicle.
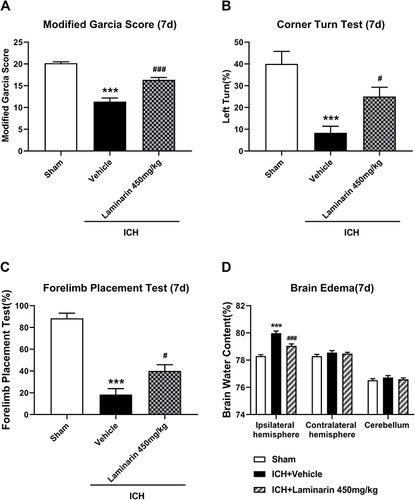
Figure 4 Dectin-1 blockade reduced ICH-induced expression of pyroptosis-associated molecules. (A) Representative Western blot bands and protein quantitative analysis of GSDMD-N; n = 4. (B) Concentrations of IL-1β and IL-18 in the perihematomal zone according to ELISA; n = 5. Data are expressed as the mean ± SEM. *p < 0.05, ***p < 0.001 vs sham. #p < 0.05, ##p < 0.01 vs ICH + vehicle.
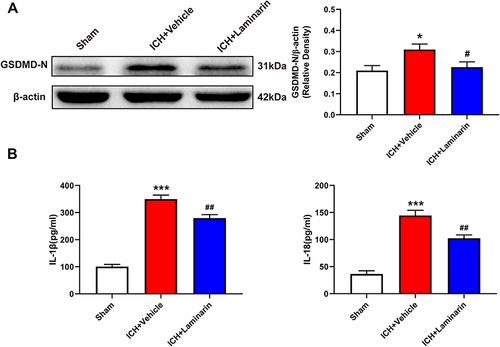
Figure 5 Laminarin inhibited the activation of the Dectin-1 signal after ICH. (A) Double immunofluorescence staining images of Dectin-1 co-located with SYK; n = 3. Scale bar = 100 μm. (B) Relative mRNA level of Dectin-1 in the perihematomal zone at 3 days following ICH; n = 6. (C and D) Protein bands and quantitative analysis of Dectin-1 and phosphorylation of SYK (p-syk); n = 4. Data are expressed as the mean ± SEM. ***p < 0.001 vs sham. ##p < 0.01, ###p < 0.001 vs ICH + vehicle.
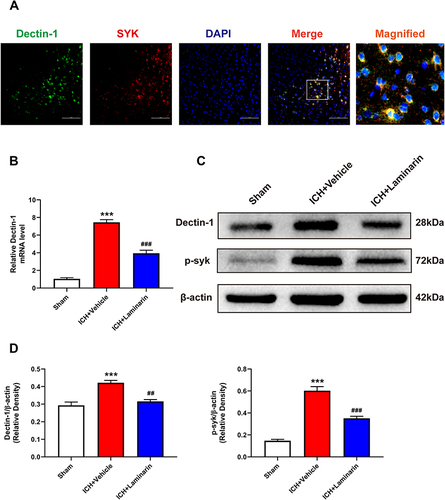
Figure 6 Dectin-1 blockade downregulated the expression of NLRP3 inflammasomes and associated inflammatory cytokines. (A) Transcription levels of NLRP3, ASC, caspase-1, IL-1β, and IL-18 at 3 days following ICH; n = 6. (B–D) Protein bands and protein quantitative analysis of NLRP3, ASC, and cleaved caspase-1. (C–E) Protein bands and protein quantitative analysis of IL-1β and IL-18; n = 4. Data are expressed as the mean ± SEM. *p < 0.05, **p < 0.01, ***p < 0.001 vs sham. #p < 0.05, ##p < 0.01, ###p < 0.001 vs ICH + vehicle.
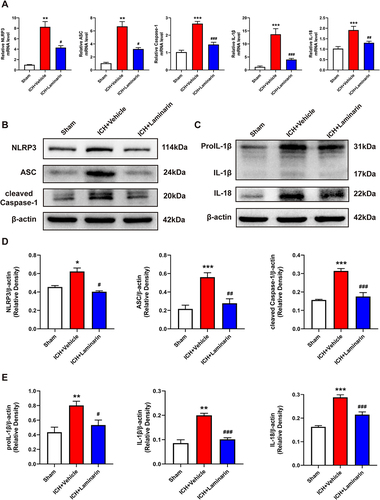
Figure 7 Inhibition of Dectin-1 attenuated LPS-stimulated Dectin-1 signaling and microglial pyroptosis in vitro. (A) Western blot bands and protein quantitative analysis of Dectin-1, p-syk, NLRP3, ASC, procaspase-1, and proIL-1β in BV2 microglia lysates. (B) Western blot bands and protein quantitative analysis of pyroptosis-associated proteins, including cleaved caspase-1, IL-1β, and GSDMD-N, in BV2 microglia lysates; n = 4. Data are expressed as the mean ± SEM. **p < 0.01, ***p < 0.001 vs control. #p < 0.05, ##p < 0.01, ###p < 0.001 vs LPS.
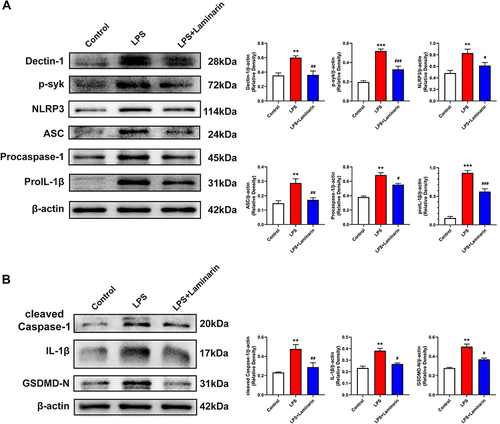
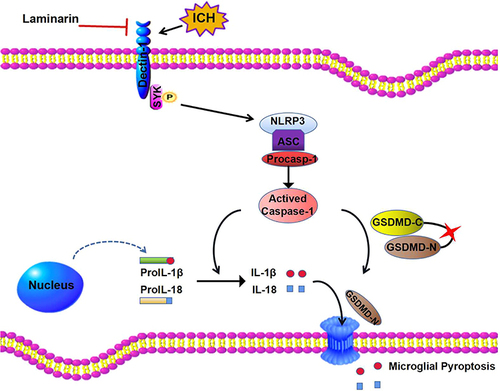
Figure 8 Diagram of Dectin-1-mediated microglial pyroptosis after ICH. The level of Dectin-1 is upregulated following ICH injury. Dectin-1 initiates SYK phosphorylation and mobilizes the NLRP3/caspase-1 downstream pathway to generate inflammatory mediators. In addition, the activated caspase-1 induced by Dectin-1 initiation cleaves GSDMD to release an N-terminal fragment, which forms pores on microglia, resulting in the extracellular release of inflammatory factors such as IL-1β and IL-18. Inhibiting Dectin-1 by laminarin alleviates inflammatory responses, resulting in easing of intracerebral hemorrhage.