Figures & data
Figure 1 Expression patterns of FLT3LG mRNA in CESC from TIMER, TCGA, and our cohort database. (A) The FLT3LG expression in different cancer types from the TIMER database. (B) FLT3LG expression was significantly decreased in CESC from the TCGA-CESC data sets. (C–E) The expression level of FLT3LG was analyzed using the TCGA-CESC data sets according to (C) OS, (D) DSS, and (E) PFI. (F) FLT3LG expression level decreased in clinical specimens. Analysis between two groups: Wilcoxon Rank sum test; NS: P= 0.05 or higher; *P < 0.05; **P < 0.01; ***P < 0.001.
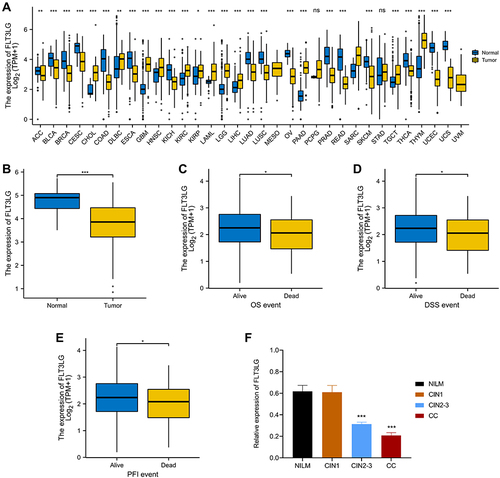
Table 1 Clinical Characteristics of the Participants of the Study
Table 2 Univariate and Multivariate Cox’s Regression Analysis of Factors Associated with OS in Cervical Cancer with TCGA Database
Figure 2 The diagnostic and prognostic value of FLT3LG in CESC is based on the TCGA-CESC data sets and our cohort. (A–C) Survival curves showed OS, DSS, and PFI rates of CESC patients with low or high FLT3LG expression. (D–I) Survival curves showed OS of CESC patients with low or high FLT3LG expression according to (D) T stage, (E) N stage,(F) M stage, (G) Radiation therapy, (H) Histological types, and (I) clinical stage. (J–K) ROC analysis illustrated that FLT3LG expression accurately discriminated CESC tumor tissues from the normal tissues with an AUC of 0.820 (95% CI = 0.709–0.930) from the TCGA-CESC data set and an AUC of 0.811 (95% CI = 0.773–0.848) from our cohort.
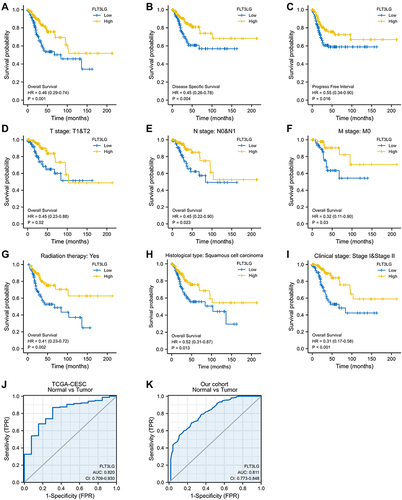
Table 3 Independent Predictors for Detection of CIN2+ Lesions
Figure 3 A prognostic, predictive model of FLT3LG in CESC. (A) Nomogram for predicting the probability of 1-, 3-, and 5-year OS for CESC. (B) Calibration plot of the nomogram for predicting the likelihood of OS at 1, 3, and 5 years.
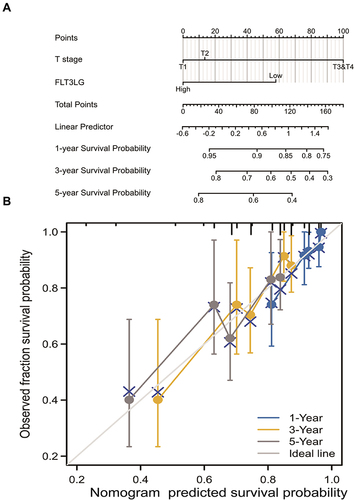
Figure 4 Correlation of FLT3LG expression with immune infiltration in CESC. (A) Correlation between the expression of FLT3LG and the abundance of TILs in cervical cancer. (B) Correlation of FLT3LG expression with infiltration levels of CD8+ T cell, CD4+ T cell, T-cell regulatory, B cell, neutrophil, monocyte (rho = 0.728), and macrophage M1, myeloid dendritic cell, Mast cell activated, cancer-associated fibroblast, Hematopoietic stem cell, T cell follicular helper, T cell gamma delta in cervical cancer available at TIMER2.0 database. Color images are available online.
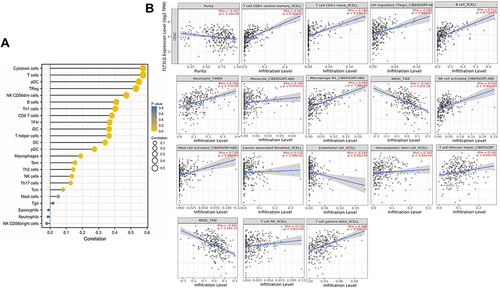
Table 4 Correlation Analysis Between FLT3LG and Related Genes and Markers of Monocyte, Macrophages, and T-Cell Exhaustion in Gene Expression Profiling Interaction Analysis (GEPIA)
Figure 5 FLT3LG expression correlated with monocyte, macrophages, and T cell exhaustion in CESC. Markers include IRF5, and PTGS2 of M1 macrophages (A), CD163, VSIG4, and MS4A4A of M2 macrophages (B), PDCD1, PDCD1G2, CTLA4, LAG3, HAVCR2, GZMB of T-cell exhaustion (C), CD86 and CSF1R of monocytes (D) and CCL2, CD68, and IL10 of TAMs(E).
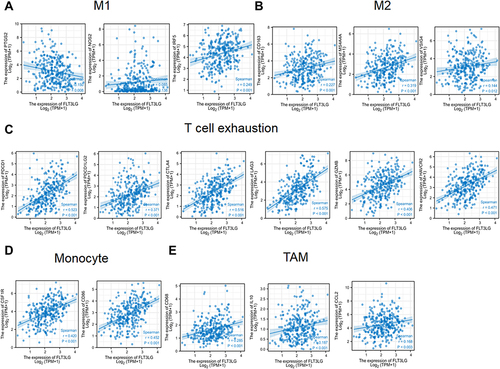
Figure 6 The expression of FLT3LG is associated with immunoinhibitors and immunostimulators in cervical cancer. (A) Correlation between FLT3LG expression and immunoinhibitors in cervical cancer available at TISIDB database. (B) Correlation between FLT3LGexpression and immunostimulators in cervical cancer available at TISIDB database. Color images are available online.
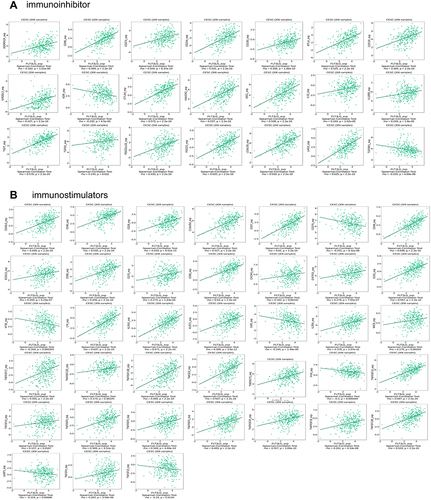
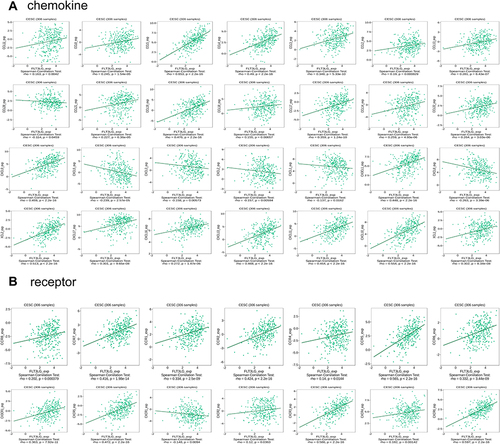
Figure 7 The expression of FLT3LG is associated with chemokines and receptors in cervical cancer. (A) Correlation between FLT3LG expression and chemokines in cervical cancer available at TISIDB database. (B) Correlation between FLT3LG expression and receptors in cervical cancer available at TISIDB database. Color images are available online.