140
Views
2
CrossRef citations to date
0
Altmetric
ORIGINAL RESEARCH

Downregulation of ST6GAL1 Promotes Liver Inflammation and Predicts Adverse Prognosis in Hepatocellular Carcinoma

, , , , , , , & show all
Pages 5801-5814 | Received 12 Aug 2022, Accepted 15 Sep 2022, Published online: 10 Oct 2022

Figures & data

Figure 1 ST6GAL1 expression in normal and HCC liver tissues. (A) The ST6GAL1 mRNA expression of HCC (n = 371) and normal tissues (n = 160) in the TCGA and GTEx databases; (B) The ST6GAL1 mRNA expression of HCC (n = 371) and adjacent non-tumor tissues (n = 50) in the TCGA database; (C and D) The ST6GAL1 mRNA expression of different T stages (C) or histologic grades (D) in the TCGA database; (E) The ST6GAL1 protein expression in the HPA database; (F) The ST6GAL1 mRNA expression levels in liver tissues of normal (n = 6) and HCC (n = 6) rats, detected by qRT-PCR and GAPDH as the internal reference; (G) The ST6GAL1 protein expression levels in liver tissues of normal (n = 6) and HCC (n = 6) rats, detected by capillary electrophoresis analysis and GAPDH as the internal reference; (H) The integrated density analysis of the protein bands. *p < 0.05, **p < 0.01, ***p < 0.001.
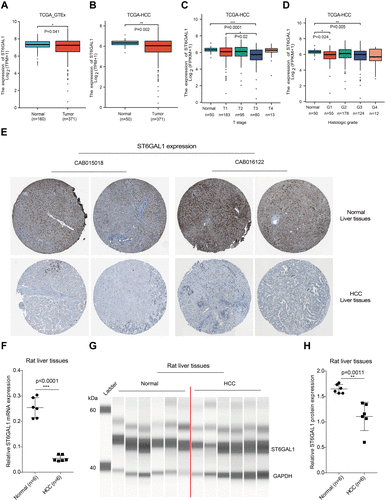
Figure 1 ST6GAL1 expression in normal and HCC liver tissues. (A) The ST6GAL1 mRNA expression of HCC (n = 371) and normal tissues (n = 160) in the TCGA and GTEx databases; (B) The ST6GAL1 mRNA expression of HCC (n = 371) and adjacent non-tumor tissues (n = 50) in the TCGA database; (C and D) The ST6GAL1 mRNA expression of different T stages (C) or histologic grades (D) in the TCGA database; (E) The ST6GAL1 protein expression in the HPA database; (F) The ST6GAL1 mRNA expression levels in liver tissues of normal (n = 6) and HCC (n = 6) rats, detected by qRT-PCR and GAPDH as the internal reference; (G) The ST6GAL1 protein expression levels in liver tissues of normal (n = 6) and HCC (n = 6) rats, detected by capillary electrophoresis analysis and GAPDH as the internal reference; (H) The integrated density analysis of the protein bands. *p < 0.05, **p < 0.01, ***p < 0.001.

Figure 2 The correlation between ST6GAL1 mRNA expression and HCC patients’ prognosis in TCGA database. (A and B) The overall survival (n = 364, (A)) and relapse-free survival (n = 316, (B)) analysis between ST6GAL1 expression and HCC; (C) A nomogram that combines ST6GAL1 and other prognostic factors in HCC; (D) The calibration curve of the nomogram; (EH) The overall survival analysis of ST6GAL1 expression in HCC patients with viral hepatitis (n = 150, (E)), no-viral hepatitis (n = 167, (F)), alcohol consumption (n = 115, (G)), and no-alcohol consumption (n = 202, (H)).
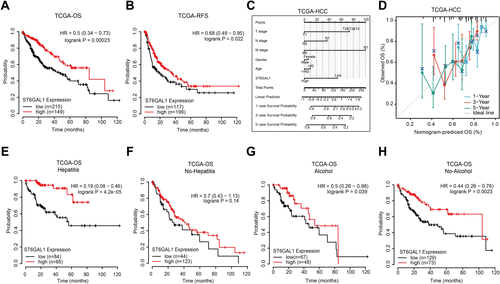
Figure 2 The correlation between ST6GAL1 mRNA expression and HCC patients’ prognosis in TCGA database. (A and B) The overall survival (n = 364, (A)) and relapse-free survival (n = 316, (B)) analysis between ST6GAL1 expression and HCC; (C) A nomogram that combines ST6GAL1 and other prognostic factors in HCC; (D) The calibration curve of the nomogram; (E–H) The overall survival analysis of ST6GAL1 expression in HCC patients with viral hepatitis (n = 150, (E)), no-viral hepatitis (n = 167, (F)), alcohol consumption (n = 115, (G)), and no-alcohol consumption (n = 202, (H)).

Figure 3 The associations of ST6GAL1 mRNA expression with gene copy number variation and methylation in HCC. (A) The ST6GAL1 mRNA expression in tumor tissues of gene copy neutral (n = 262), deletion (n = 44), and duplication (n = 55) groups in the TCGA-HCC database; (B) The correlation between ST6GAL1 mRNA expression and gene methylation level of liver tissues in the TCGA-HCC database; (C) The ST6GAL1 methylation levels in HCC (n = 377) and normal liver tissues (n = 50) in the TCGA-HCC database; (D) The overall survival analysis between ST6GAL1 methylation level and HCC in the TCGA-HCC database. **p < 0.01.
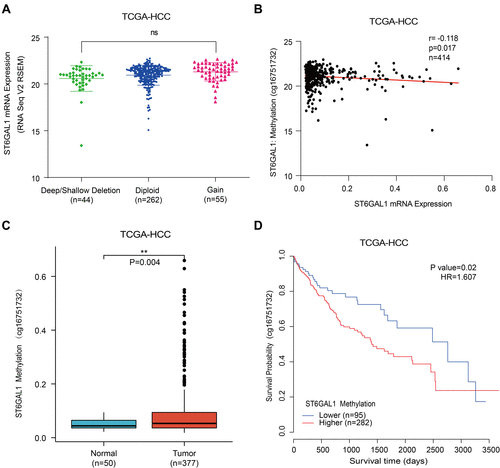
Figure 3 The associations of ST6GAL1 mRNA expression with gene copy number variation and methylation in HCC. (A) The ST6GAL1 mRNA expression in tumor tissues of gene copy neutral (n = 262), deletion (n = 44), and duplication (n = 55) groups in the TCGA-HCC database; (B) The correlation between ST6GAL1 mRNA expression and gene methylation level of liver tissues in the TCGA-HCC database; (C) The ST6GAL1 methylation levels in HCC (n = 377) and normal liver tissues (n = 50) in the TCGA-HCC database; (D) The overall survival analysis between ST6GAL1 methylation level and HCC in the TCGA-HCC database. **p < 0.01.

Figure 4 The ST6GAL1-related differential expression genes (DEGs) and functional enrichment analysis in HCC. (A) Volcano plot of ST6GAL1 related DEGs; (BE) The GO-CC (B), GO-MF (C), GO-BP (D), and KEGG (E) enrichment analysis of ST6GAL1 related DEGs; (F) The expression heatmap of the ST6GAL1-related DEGs.
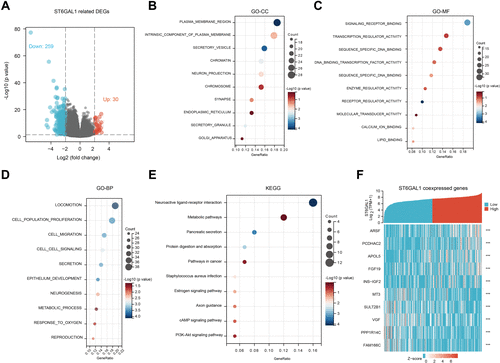
Figure 4 The ST6GAL1-related differential expression genes (DEGs) and functional enrichment analysis in HCC. (A) Volcano plot of ST6GAL1 related DEGs; (B–E) The GO-CC (B), GO-MF (C), GO-BP (D), and KEGG (E) enrichment analysis of ST6GAL1 related DEGs; (F) The expression heatmap of the ST6GAL1-related DEGs.

Figure 5 The association between ST6GAL1 mRNA expression and liver inflammation status. (AC) ST6GAL1 expression of HCC tissues in no-viral hepatitis (VH) and VH groups (A), no-alcoholic liver disease (ALD) and ALD groups (B), and no-non-alcoholic fatty liver disease (NAFLD) and NAFLD groups (C) in the TCGA-HCC database; (D and E) Correlation between ST6GAL1 mRNA expression and alanine aminotransferase (ALT, (D)), and aspartate aminotransferase (AST, (E)) levels in the GSE83148 dataset; (F and G) Correlation between ST6GAL1 mRNA expression and ALT (F) and AST (G) levels in the GSE84044 dataset; (H) Expression of ST6GAL1 among hepatitis patients with Scheuer grades of G0, G1-G4 in the GSE84044 dataset; (I) ST6GAL1 expression of normal liver, chronic inflammatory liver, cirrhotic livers, early HCC, and advanced HCC in GSE54238 dataset. *p < 0.05, **p < 0.01, ***p < 0.001.
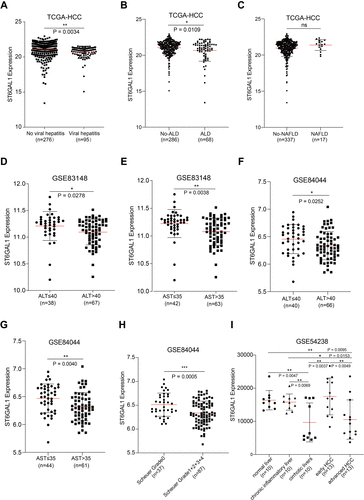
Figure 5 The association between ST6GAL1 mRNA expression and liver inflammation status. (A–C) ST6GAL1 expression of HCC tissues in no-viral hepatitis (VH) and VH groups (A), no-alcoholic liver disease (ALD) and ALD groups (B), and no-non-alcoholic fatty liver disease (NAFLD) and NAFLD groups (C) in the TCGA-HCC database; (D and E) Correlation between ST6GAL1 mRNA expression and alanine aminotransferase (ALT, (D)), and aspartate aminotransferase (AST, (E)) levels in the GSE83148 dataset; (F and G) Correlation between ST6GAL1 mRNA expression and ALT (F) and AST (G) levels in the GSE84044 dataset; (H) Expression of ST6GAL1 among hepatitis patients with Scheuer grades of G0, G1-G4 in the GSE84044 dataset; (I) ST6GAL1 expression of normal liver, chronic inflammatory liver, cirrhotic livers, early HCC, and advanced HCC in GSE54238 dataset. *p < 0.05, **p < 0.01, ***p < 0.001.

Figure 6 The association of ST6GAL1 mRNA expression and immune cell infiltration. (A) Immune cell infiltration levels of high- and low-ST6GAL1 expression groups in HCC; (B) Correlation between ST6GAL1 mRNA expression and immune cell infiltration in HCC; (C) Correlation between ST6GAL1 mRNA expression and immunoinhibitors or immunostimulators in HCC; (D) Correlation between ST6GAL1 mRNA expression and TGFB1, KDR, IL6R, and TNFRSF9 in HCC. *p < 0.05, **p < 0.01, ***p < 0.001.
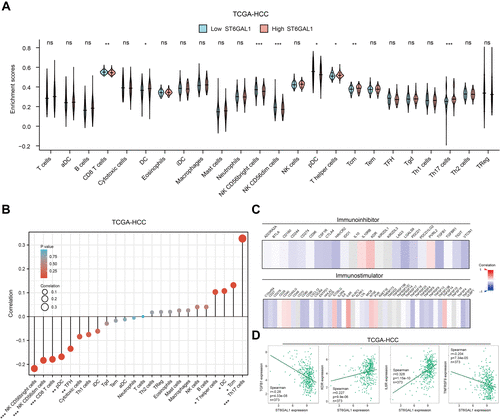
Figure 6 The association of ST6GAL1 mRNA expression and immune cell infiltration. (A) Immune cell infiltration levels of high- and low-ST6GAL1 expression groups in HCC; (B) Correlation between ST6GAL1 mRNA expression and immune cell infiltration in HCC; (C) Correlation between ST6GAL1 mRNA expression and immunoinhibitors or immunostimulators in HCC; (D) Correlation between ST6GAL1 mRNA expression and TGFB1, KDR, IL6R, and TNFRSF9 in HCC. *p < 0.05, **p < 0.01, ***p < 0.001.