Figures & data
Figure 1 Flowchart of patient enrollment.
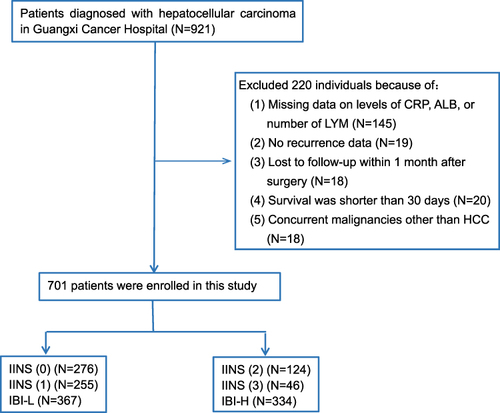
Table 1 Characteristics of Enrolled Patients with Resectable Hepatocellular Carcinoma
Figure 2 Receiver operating characteristic curves of the following indices for overall survival in patients with hepatocellular carcinoma: (A) IINS, (B) IBI, (C) CAR, (D) PLR, (E) SII, (F) NLR, (G) PNI, (H) PI, (I) GPS, and (J) mGPS.
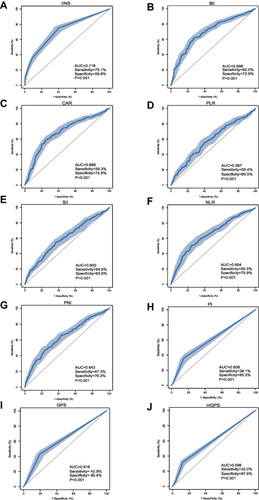
Table 2 Optimal Cut-Off Values for Inflammatory and Nutritional Indicators
Table 3 Associations of IINS and IBI with Clinicopathological Characteristics in Patients with Hepatocellular Carcinoma
Figure 3 Kaplan–Meier survival curves of HCC patients after hepatectomy, stratified by (A and B) inflammation-immunity-nutrition score (IINS) or (C and D) inflammatory burden index (IBI).
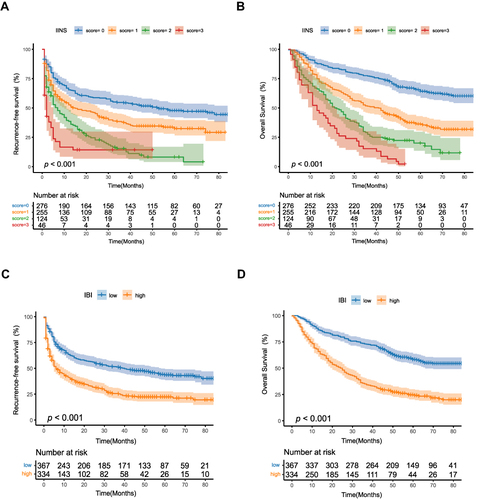
Table 4 Univariate Analysis to Identify Clinicopathological Characteristics Associated with Poor DFS and OS
Table 5 Multivariate Analysis of the Three Models to Predict DFS and OS
Figure 4 Model 1 for predicting OS of HCC patients after hepatectomy. (A) Nomogram of the model. (B–D) Calibration curves for OS at (B) 1 year, (C) 3 years and (D) 5 years. The light gray line indicates the ideal, where predictions match observations. The red dots were calculated by bootstrapping (1000 resamplings) and describe the performance of the nomogram: the closer the solid red line is to the light gray line, the more accurately the model predicts survival.
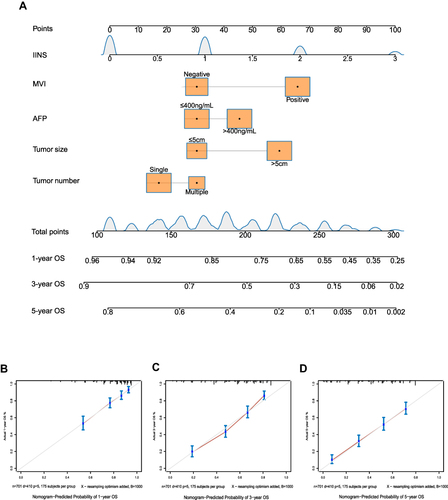
Figure 5 Model 2 for predicting OS of HCC patients after hepatectomy. (A) Nomogram of the model. (B–D) Calibration curves for OS at (B) 1 year, (C) 3 years and (D) 5 years.
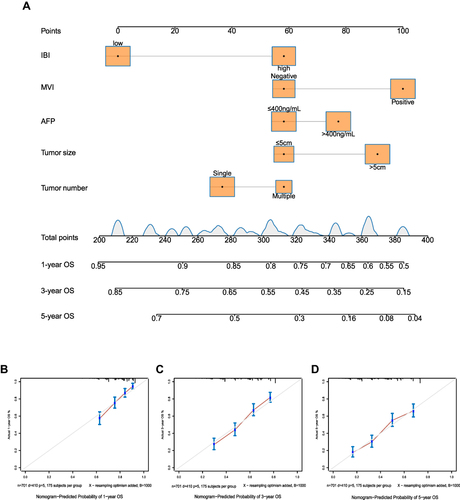
Figure 6 Model 3 to predict OS of HCC patients after hepatectomy. (A) Nomogram of the model. (B–D) Calibration curves for OS at (B) 1 year, (C) 3 years and (D) 5 years.
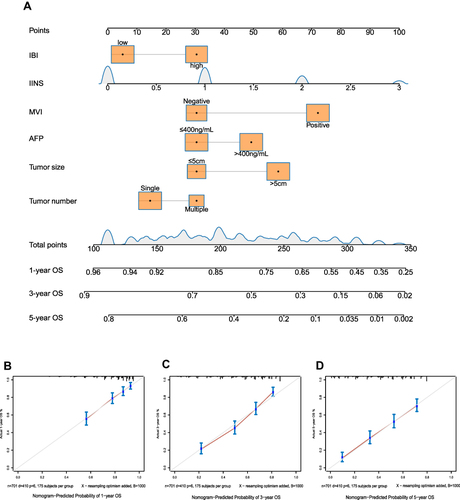
Table 6 Comparison of Concordance Indices for Different Models to Predict Disease-Free Survival and Overall Survival
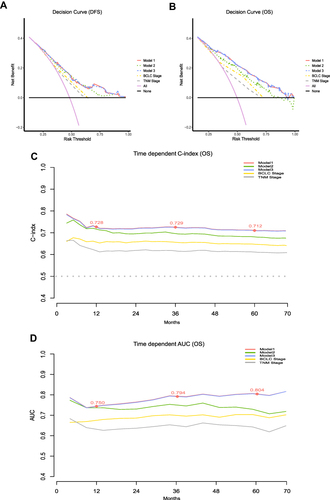
Figure 7 Comparison of models and traditional clinical staging systems for predicting prognosis. (A and B) Decision curve analysis (DCA) of nomogram models. The horizontal solid black line represents the hypothesis that no patients reached the endpoint, and the solid pink line represents the hypothesis that all patients met the endpoint. Model 1 showed the highest area under the curve and emerged as the optimal decision-making tool for maximal net benefit in HCC patients after hepatectomy. (C) Time-dependent C -index. (D) Time-dependent AUCs. The red nodes represent C-index or AUC values of Model 1 for 1 year, 3 years and 5 years.