Figures & data
Figure 1 Sodium tanshinone IIA sulfonate alleviates atherosclerosis in ApoE−/− mice. (A) Body Weight, (B) plasma total cholesterol (TC) level, (C) plasma triglyceride (TG) level, (D) Plasma low-density lipoprotein cholesterol (LDL-c) level, and (E) plasma high density liptein cholesterol (HDL-c) level. (F) H&E staining of the aortic arches of the ApoE−/− mice. (G) Masson staining of the aortic arches. (H) Oil red O staining of the aortic arches. Data are represented as mean ± SD of three independent replicates; **P < 0.01 vs NCD group; †P < 0.05, ††P < 0.01 vs AS model group.
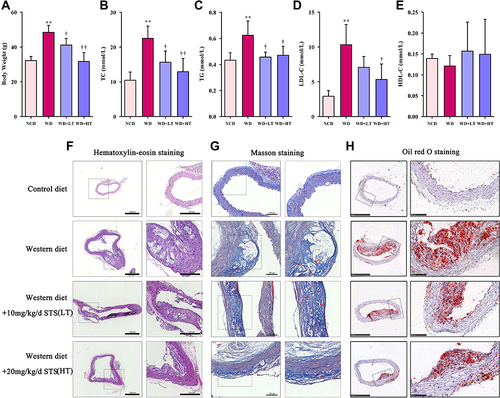
Figure 2 Sodium tanshinone IIA sulfonate alleviates the pyroptosis in atherosclerotic plaques. (A) NLRP3 and ASC in endothelial cells (marked by CD31) the aortic arches were detected by immunofluorescence. (B) GSDMD level in sections of the aortic arches was detected by immunofluorescence. (C) Immunohistochemistry analysis of IL-1β expression. (D) Immunohistochemistry analysis of IL-18 expression. Data are represented as mean ± SD of three independent replicates; *P < 0.05, **P < 0.01 vs NCD group; †P < 0.05, ††P < 0.01 vs AS model group; Scale bar = 50 μm.
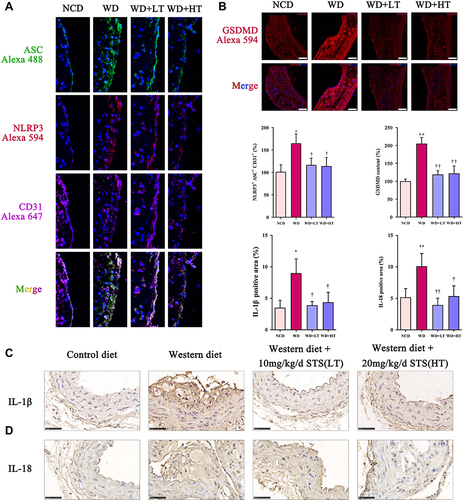
Figure 3 Sodium tanshinone IIA sulfonate alleviates cholesterol crystals-induced pyroptotic damage in HUVECs. HUVECs were incubated with 500 μM cholesterol crystals (CC) for 16 h. 10, 20, 40 μM Sodium tanshinone IIA sulfonate (STS) was added 1 h before CC treatment. (A) Cell death was determined using PI staining. (B) NLRP3, ASC, caspase-1, GSDMD and IL-1β protein levels were determined by Western blot. (C) NLRP3 specks were detected by immunofluorescence. Data are represented as mean ± SD of three independent replicates; **P < 0.01 vs VEH group; §P < 0.05, §§P < 0.01 vs cholesterol crystals group; Scale bar = 10 μm.
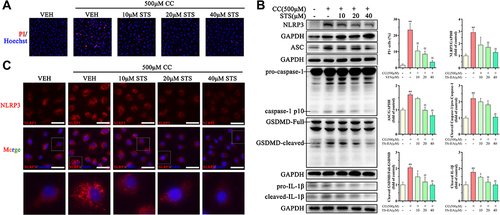
Figure 4 Sodium tanshinone IIA sulfonate alleviates cholesterol crystals-induced mitochondrial damage in HUVECs. HUVECs were incubated with 500 μM cholesterol crystals (CC) for 16 h. 10, 20, 40 μM Sodium tanshinone IIA sulfonate (STS) was added 1 h before CC treatment. (A) Representative images of TMRE staining in HUVECs that were stained with TMRE (red, to label MMP) and Hoechst 33342 (blue, to label nuclear). (B) HUVECs were stained with Mito-SOX probe (red, to label mtROS), Mito-tracker Green (green, to label mitochondrial) and Hoechst 33342 (blue, to label nuclear) and images were detected under Confocal High-Content Imaging System. Data are represented as mean ± SD of three independent replicates;**P < 0.01 vs VEH group; §P < 0.05, §§P < 0.01 vs cholesterol crystals group; Scale bar = 10 μm.
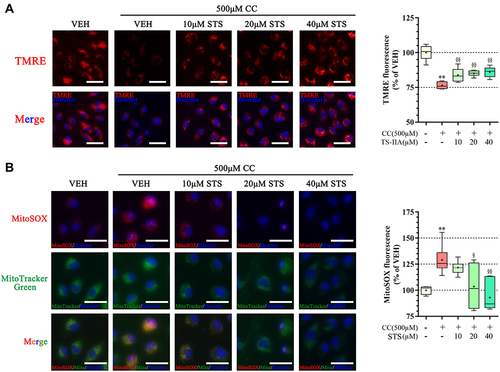
Figure 5 Sodium tanshinone IIA sulfonate activates AMPK. HUVECs were incubated with 500 μM cholesterol crystals (CC) for 16 h. 10, 20, 40 μM Sodium tanshinone IIA sulfonate (STS) was added 1 h before CC treatment. (A) p-AMPK level in sections of the aortic arches was detected by immunofluorescence. (B) p-AMPKThr172, AMPK protein levels were determined by Western blot. Data are represented as mean ± SD of three independent replicates; **P < 0.01 vs VEH group; §§P < 0.01 vs cholesterol crystals group; ††P < 0.01 vs STS treatment group.
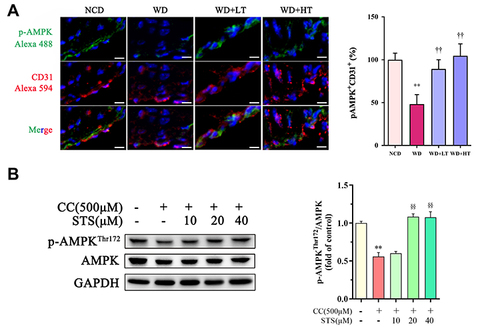
Figure 6 Inhibition of AMPK signaling eliminates the protective effect of Sodium tanshinone IIA sulfonate on cholesterol crystals-induced endothelial pyroptosis. HUVECs were incubated with 500 μM cholesterol crystals (CC) for 16 h and 40 μM Sodium tanshinone IIA sulfonate (STS) was added 1 h before CC treatment. 10 μM Dorsomorphin was added 2 h before STS treatment. (A) Cell death was determined using PI staining. (B) NLRP3, ASC, caspase-1, GSDMD and IL-1β protein levels were determined by Western blot. (C) NLRP3 specks were detected by immunofluorescence. Data are represented as mean ± SD of three independent replicates; **P < 0.01 vs VEH group; §P < 0.05, §§P < 0.01 vs cholesterol crystals group; †P < 0.05, ††P < 0.01 vs STS treatment group; Scale bar = 10 μm.
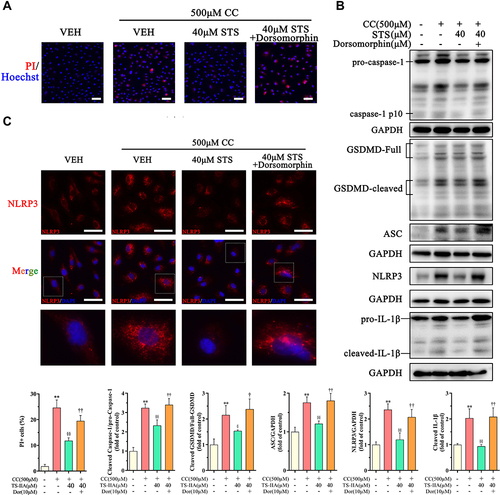
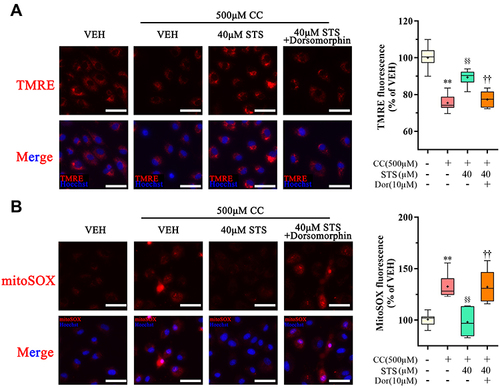
Figure 7 Inhibition of AMPK signaling eliminates the protective effect of Sodium tanshinone IIA sulfonate on cholesterol crystals-induced mitochondrial damage. HUVECs were incubated with 500 μM cholesterol crystals (CC) for 16 h and 40 μM Sodium tanshinone IIA sulfonate (STS) was added 1 h before CC treatment. 10 μM Dorsomorphin was added 2 h before STS treatment. (A) Representative images of TMRE staining in HUVECs that were stained with TMRE (red, to label MMP) and Hoechst 33342 (blue, to label nuclear). (B) HUVECs were stained with Mito-SOX probe (red, to label mtROS), Mito-tracker Green (green, to label mitochondrial) and Hoechst 33342 (blue, to label nuclear) and images were detected under Confocal High-Content Imaging System. Data are represented as mean ± SD of three independent replicates; **P < 0.01 vs VEH group; §§P < 0.01 vs cholesterol crystals group; ††P < 0.01 vs STS treatment group; Scale bar = 10 μm.