Figures & data
Table 1 Primers Used in Real-Time PCR
Table 2 BMI in Relation to Glucose, Insulin, IRI and HbA1c Among Healthy Persons and Overweight as Well as Class I and II Obese Diabetic Patients
Table 3 Levels of TC, TG and HDL-C Among Healthy Persons, Overweight as Well as Obese Class I and II Diabetic Patients
Table 4 Levels of Plasma TNF- α, MCP-1 and TGF-β1 in Healthy Persons and Overweight as Well as Obese Class I and II Diabetic Patients
Table 5 Levels of Blood SOD and CAT as Well as Plasma TBARs Among Healthy Persons and Overweight as Well as Class I and II Obese Diabetic Patients
Figure 1 iNOS gene expression levels among healthy persons and overweight as well as class I and II obese diabetic patients. Data shown are mean ± standard deviation of number of observations within each treatment. Data followed by different superscript alphabet along the same column are significantly different (p < 0.05). The high significant levels of the parameters were in the order of a < b < c < d. Data with superscript alphabet “a” are significantly lower than data with superscript alphabet “b” while data with superscript “b” are lower than data with superscript alphabet “c and d” at p < 0.05. Data followed by the same superscript alphabet are not significantly different at p ≤ 0.05.
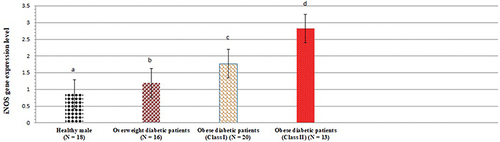
Figure 2 Vanin-1 gene expression levels among healthy persons and overweight as well as class I and II obese diabetic patients. Data shown are mean ± standard deviation of number of observations within each treatment. Data followed by different superscript alphabet along the same column are significantly different (p < 0.05). The high significant levels of the parameters were in the order of a < b < c < d. Data with superscript alphabet “a” are significantly lower than data with superscript alphabet “b” while data with superscript “b” are lower than data with superscript alphabet “c and d” at p < 0.05. Data followed by the same superscript alphabet are not significantly different at p ≤ 0.05. N= number of participants in each group.
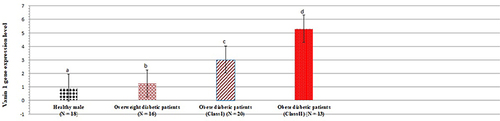
Table 6 Correlation Between the Expression of Vanin 1 and Glucose Homeostasis Indices, HbA1c, Lipid Profile, Inflammatory Mediators, and Oxidative Stress Biomarkers in Healthy Persons and Overweight as Well as Class I and II Obese Diabetic Patients
Figure 3 Ultrasound (US) imaging of liver in healthy persons and overweight as well as class I and II obese patients. Normal liver contrast with white asterisks demarcating normal hepatic parenchyma for comparison at same depth (A). US of overweight diabetic patients showed the presence of fatty liver with increased liver echogenicity (B). Also, fatty liver with mild hepatic echogenicity obscuring was apparent in class I obese diabetic patients (C). In addition, US liver examination of class II obese diabetic patients showed a marked fatty liver with echogenic liver obscuring the echogenic walls of portal venous branches (D).
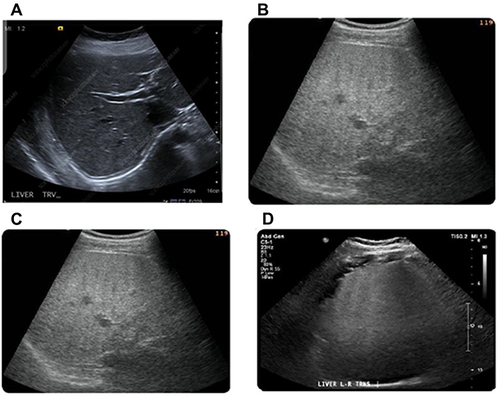
Figure 4 CT scan of liver in healthy persons and overweight diabetic as well as class I and II obese patients. Normal appearance of the liver at unenhanced CT (A). CT of overweight diabetic patients showed diffuse fat accumulation in the liver (B). Also, Focal fat accumulation in the liver at CT in class I obese diabetic patients (C). In addition, CT liver examination of class II obese diabetic patients showed multifocal fat accumulation in the liver at CT (D).
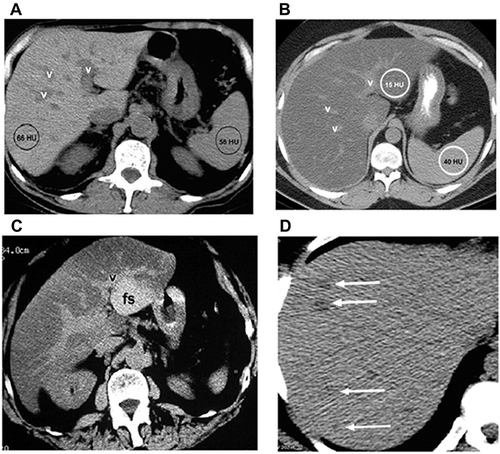
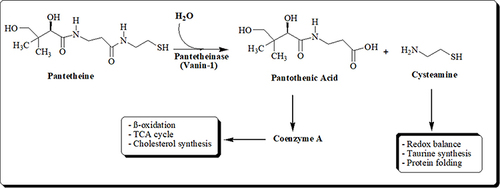
Figure 5 Schematic diagram of the hydrolysis of Pantetheine.