Figures & data
Table 1 Dataset Included in the Study
Figure 1 The illustrations for this study. The overall protocol utilized in the current study to comprehensively characterize of costimulatory molecule gene for diagnosis, prognosis and recognition of immune microenvironment features in sepsis.
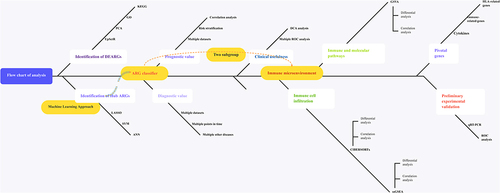
Figure 2 Identification of differentially expressed ARGs in sepsis and Functional enrichment analysis. (A) An UpSet diagram exhibited the interactions result of GEO datasets difference analysis and ARG cohorts. (B–I) Principal component analysis for the expression profiles of DEARGs to distinguish sepsis patients from healthy control/uninfected control/control patients in multi-transcriptome cohorts. (B) GSE54514 datasets; (C) GSE57065 datasets; (D) GSE65682 datasets; (E) GSE69063 datasets; (F) GSE69528 datasets; (G) GSE95233 datasets; (H) GSE131761 datasets; (I) GSE154918 datasets. (J and K) Bubble plots illustrating functional enrichment analysis using DEARGs. (J) The top 15 significant terms of Gene Ontology (GO), including the molecular function (MF), cellular component (CC), and biological process (BP). (K) The top 15 significant pathways in Kyoto Encyclopedia of Genes and Genomes (KEGG) enriched.
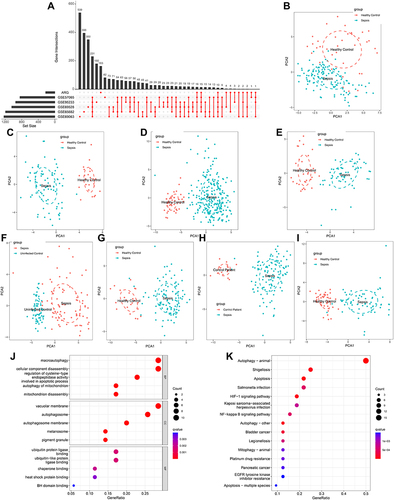
Figure 3 Identification of prognosis-related ARGs (sepsis-specific ARGs) and construction of a ARG classifier based on machine learning algorithms (including Lasso, SVM, ANN). (A–D) Modified Lasso was used to identify candidate ARGs with 10-fold cross-validation in multi-transcriptome datasets. The Y-axis shows mean-square error and the X-axis is Log (λ). Dotted vertical lines represent minimum and 1 standard error values of λ. The genes selected at minimum standard error values of λ were finally used for further analysis. (A) GSE54514 datasets (N=20); (B) GSE63042 datasets (N=18); (C) GSE65682 datasets (N=12); (D) GSE95233 datasets (N=24). (E–H) Modified Lasso was used to identify candidate ARGs with 10-fold cross-validation in multi-transcriptome datasets. SVM algorithm was applied to screen candidate ARGs. The red dots indicated the lowest error rate and the highest precision when genes are this number. (E) GSE54514 datasets (N=25); (F) GSE63042 datasets (N=22); (G) GSE65682 datasets (N=40); (H) GSE95233 datasets (N=16). (I) An UpSet diagram exhibited the interactions result of Lasso and SVM in multi-transcriptome datasets. (J) The visualization of artificial neural network (ANN). The neural network contains 8 input layers, 4 hidden layers, and 2 output layers.
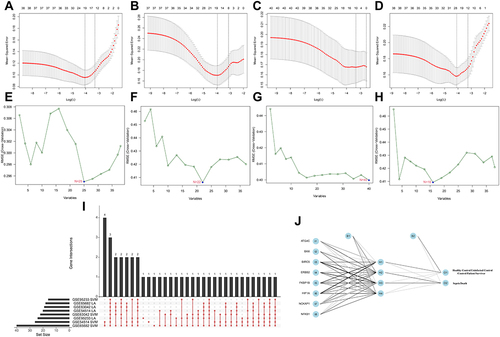
Figure 4 The diagnostic efficacy of ARG classifier in multi-transcriptome datasets. (A–H) ROC curves analyzed the diagnostic accuracy of ARG classifier in multiple datasets and time points. (A) GSE54514 datasets; (B) GSE57065 datasets; (C) GSE65682 datasets; (D) GSE69063 datasets; (E) GSE69528 datasets; (F) GSE95233 datasets; (G) GSE131761 datasets; (H) GSE154918 datasets. (I and J) Comparison of the ARG scores between sepsis and SIRS in GSE63042 datasets (I), uncomplicated Infection in GSE154918 datasets (J). p value was calculated using the Wilcoxon test. (K) Comparison of the ARG scores between sepsis, healthy control and anaphylaxis in GSE69063 datasets. p value was calculated using the Kruskal–Wallis test. (L) Comparison of the ARG scores between sepsis, healthy control and head trauma in GSE69063 datasets. p value was calculated using the Kruskal–Wallis test. (M–P) Principal component analysis based on hub ARGs to distinguish sepsis from SIRS (M), uninfected control (N), anaphylaxis (O), and head trauma (P).
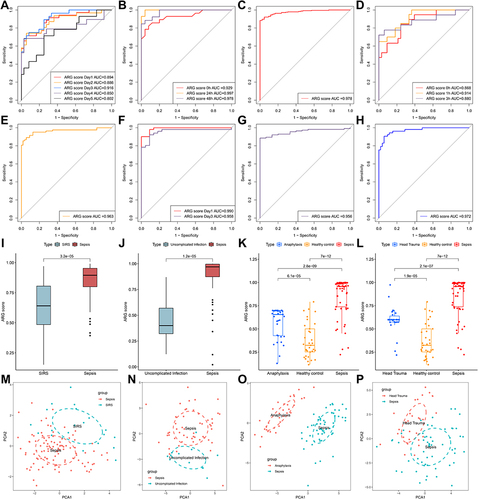
Table 2 Univariable and Multivariable Logistic Regression Analysis for Prediction of Survival in GEO and ArrayExpress Databases
Figure 5 The prognostic efficacy of ARG classifier in multi-transcriptome datasets. (A) An Lollipop chart showed the AUC values of prognostic prediction in multiple datasets. (B and K) Correlation between ARG score and APACHE-II in GSE54514 datasets (B), and E-MTAB-7581 datasets (K). Correlation coefficient and p value were calculated by Spearman correlation analysis. (C, D and F) The distribution of mortality rate between low ARG and high ARG subgroups in GSE54514 datasets (C), GSE63042 datasets (D), and GSE95233 datasets (F). p value was calculated using the Chi-square test. (E) Comparison of the ARG scores between uncomplicated sepsis, severe sepsis and septic shock in GSE63042 datasets. p value was calculated using the Kruskal–Wallis test. (G, I and J) The Sankey diagram depicts the flow from the two subgroups (low ARG and high ARG) to different phenotypes and survival outcomes, in which the width of the flow rate is proportional to the patient number. (G) E-MTAB-4421 datasets; (I) E-MTAB-4451 datasets; (J) GSE65682 datasets. p value was calculated using the Chi-square test. (H and L) The heatmap depicted the distribution of clinical characteristics arranged by the increasing ARG score in GSE106878 datasets (H), and E-MTAB-7581 datasets (L). Comparison of the different clinical characteristics between low ARG and high ARG subgroups. The asterisks indicate a statistically significant p-value calculated using the Chi-square test (*p < 0.05; **p < 0.01; ***p < 0.001).
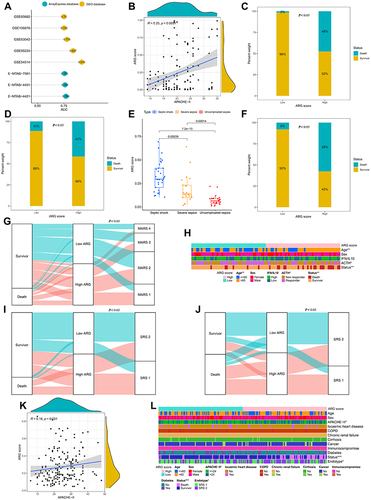
Figure 6 Clinical usefulness of ARG classifier. (A–H) Multiple ROC analysis was performed to compare the prognostic performance of the ARG classifier against clinical features in multiple cohorts. (A) GSE54514 datasets; (B) GSE63042 datasets; (C) GSE65682 datasets; (D) GSE95233 datasets; (E) GSEGSE106878 datasets; (F) E-MTAB-4421 datasets; (G) E-MTAB-4451 datasets; (H) E-MTAB-7581 datasets. (I–P) Decision curve analysis was applied to evaluate the clinical usefulness of ARG classifier against clinical features in multiple cohorts. The Y-axis represents the net benefit. The black line represents the hypothesis that no patients die. The X-axis represents the threshold probability. The threshold probability is where the expected benefit of treatment is equal to the expected benefit of avoiding treatment. (I) GSE54514 datasets; (J) GSE63042 datasets; (K) GSE65682 datasets; (L) GSE95233 datasets; (M) GSEGSE106878 datasets; (N) E-MTAB-4421 datasets; (O) E-MTAB-4451 datasets; (P) E-MTAB-7581 datasets.
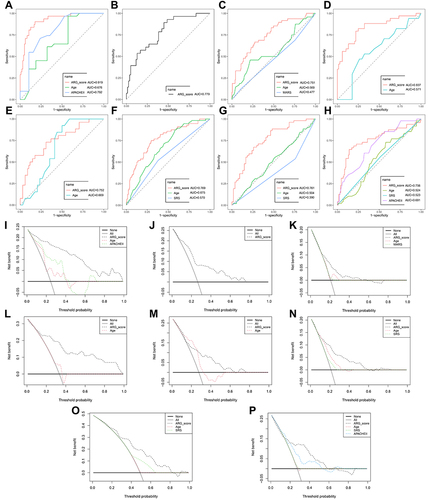
Figure 7 Analyzing the correlation between ARG classifier/hub ARGs and infiltrating immune cells in GEO datasets. (A) Comparison of infiltrating immune cells between ARG different subgroups based on CIBERSORTx tool. p value was calculated using the Wilcoxon test. (B) Comparison of infiltrating immune cells between ARG different subgroups based on ssGSEA algorithms. p value was calculated using the Wilcoxon test. (C) Correlation between ARG classifier/hub ARGs and immune cells. Correlation coefficient and p value were calculated by Spearman correlation analysis.
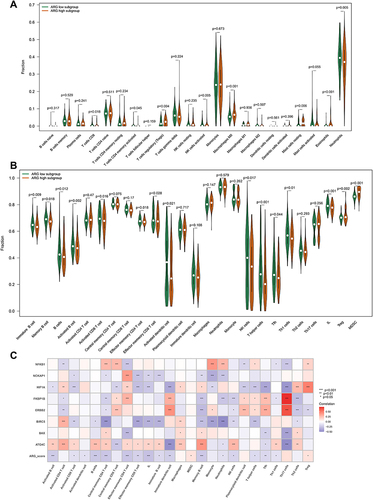
Figure 8 Analyzing the correlation between ARG classifier/hub ARGs and infiltrating immune cells in ArrayExpress datasets. (A) Comparison of infiltrating immune cells between ARG different subgroups based on CIBERSORTx tool. p value was calculated using the Wilcoxon test. (B) Comparison of infiltrating immune cells between ARG different subgroups based on ssGSEA algorithms. p value was calculated using the Wilcoxon test. (C) Correlation between ARG classifier/hub ARGs and immune cells. Correlation coefficient and p value were calculated by Spearman correlation analysis.
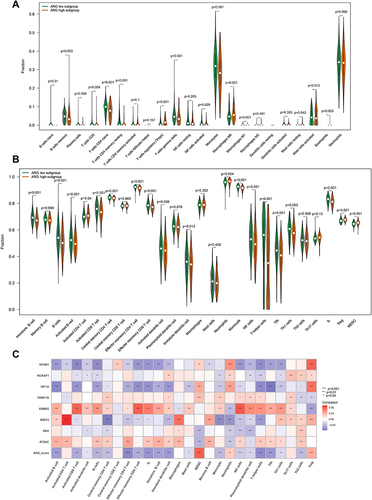
Figure 9 Analyzing the correlation between ARG classifier/hub ARGs and biological pathways in GEO and ArrayExpress datasets based on Gene set variation analysis (GSVA). (A and C) Comparison of biological pathways between ARG different subgroups in GEO datasets (A), and ArrayExpress datasets (C). (B and D) Correlation between ARG classifier/hub ARGs and biological pathways in GEO datasets (B), and ArrayExpress datasets (D). Correlation coefficient and p value were calculated by Spearman correlation analysis.
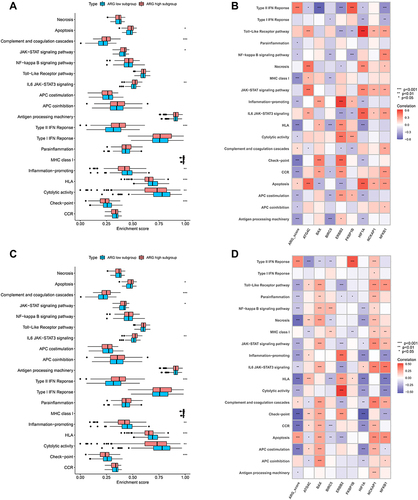
Figure 10 Analyzing the correlation between ARG classifier/hub ARGs and cytokines expression levels in GEO and ArrayExpress datasets. (A and C) Differential expression of cytokines between ARG different subgroups in GEO datasets (A), and ArrayExpress datasets (C). The asterisks indicate a significant statistical p value calculated using the Wilcoxon test (*p < 0.05; **p < 0.01; ***p < 0.001). (B and D) Correlation between ARG classifier/hub ARGs and cytokines in GEO datasets (B), and ArrayExpress datasets (D). Correlation coefficient and p value were calculated by Spearman correlation analysis.
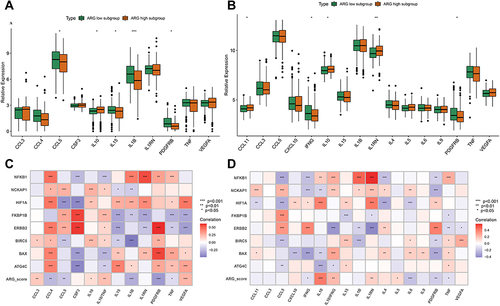
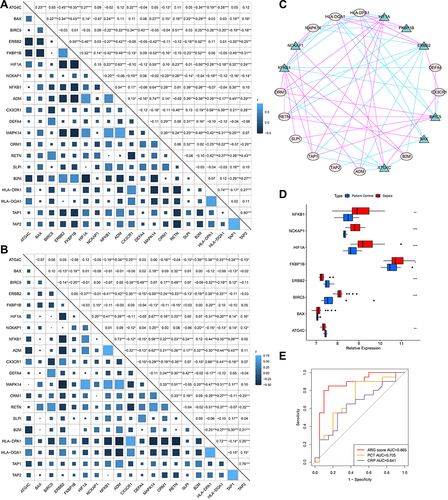
Figure 11 Correlation between Hub ARGs, immune-related genes and HLA-related genes and Preliminary experimental validation. (A and B) Correlation between Hub ARGs, immune-related genes and HLA-related genes in GEO datasets (A), and ArrayExpress datasets (B). Correlation coefficient and p value were calculated by Spearman correlation analysis (*p < 0.05; **p < 0.01; ***p < 0.001). (C) Cytoscape software depicted visually the gene-gene network regulation relation. Pink lines represent a significant positive correlation. Green lines represent a significant negative correlation. (D) Differential expression of hub ARGs between sepsis patients and control patients by qRT-PCR. The asterisks indicate a significant statistical p value calculated using the Wilcoxon test (*p < 0.05; **p < 0.01; ***p < 0.001). (E) ROC curves compared the diagnostic efficacy of ARG classifier, PCT and CRP based on clinical specimens.