Figures & data
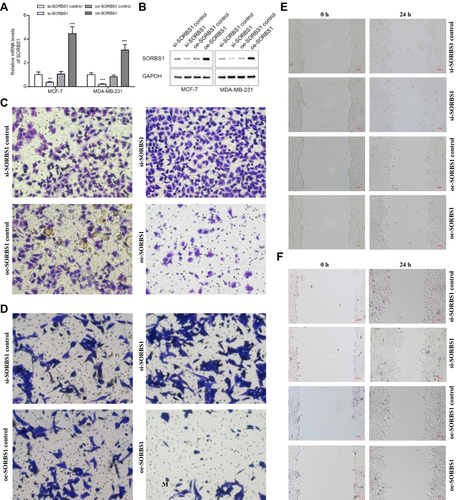
Figure 8 Effects of SORBS1 knockdown or overexpression on BC cells’ invasion and migration. (A) Quantitative PCR analysis of SORBS1 expression levels in si-SORBS1 control, si-SORBS1, oe-SORBS1 control and oe-SORBS1 breast cancer cell lines (MCF-7 and MDA-MB-231). (B) Western blot of SORBS1 expression levels in si-SORBS1 control, si-SORBS1, oe-SORBS1 control and oe-SORBS1 breast cancer cell lines (MCF-7 and MDA-MB-231). (C) Effects of SORBS1 knockdown or overexpressed on invasion of MDA-MB-231 breast cancer cells. (D) Effects of SORBS1 knockdown or overexpressed on invasion of MCF-7 breast cancer cells. (E) Effects of SORBS1 knockdown or overexpressed on migration of MDA-MB-231 breast cancer cells showed by scratch assays. (F) Effects of SORBS1 knockdown or overexpressed on migration of MCF-7 breast cancer cells showed by scratch assays. **P < 0.01; ***P < 0.001.