Figures & data
Figure 1 Effects of sympathectomy on CFA-induced mechanical allodynia and hypersensitivity of central neuron. Schematic graph showing the experimental outline, SYM, superior cervical sympathectomy; IHC, immunohistochemistry; LC, liquid chromatography (A). Quantification of mechanical thresholds of head withdrawal responses in von Frey tests, n = 8 per group (B). Immunofluorescence of c-Fos protein in SpVc at 7 days post injection. C-Fos expression levels (red) were monitored and DAPI (blue) was shown in Merge image. The dotted line shows the area of SpVc scale bar represents 200 μm (C). Quantification for c-Fos protein of SpVc; n = 4 per group (D). ns, no significant; P < 0.05 (*), 0.01 (**) compared with CFA group; P < 0.01 (##), 0.001 (###) compared with control group using one-way ANOVA with Dunnett t’s post hoc test.
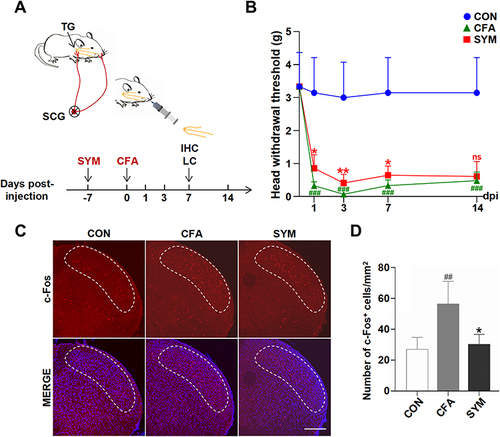
Table 1 Antibodies for Immunochemical Staining
Figure 2 Change of macrophages in sympathetic-deprived trigeminal ganglia after CFA inflammation over time. Immunofluorescence staining of CD68 shows the distribution of all activated macrophages in the maxillary nerve region of the TG at 7 dpi, Cells stained with CD68 are indicated by arrowheads. Scale bar represents 100 μm. (A) The number of CD68-positive cells in the TG from the control, CFA and SYM group, n = 4 per group (B). Immunostaining for CD86-positive cells (C) and CD163-positive cells in the TG at day 7 after the induction of inflammation. Cells stained with CD86 or CD163 are indicated by arrowheads. Scale bar represents 40 μm (D). The time course of changes in the number of CD86-positive cells (E) and CD163-positive cells among 3 groups; n = 4 per time point. (F) The ratios of M1 (CD86) to M2 (CD163) in the TG during CFA-induced orofacial pain in mice at different time points (G). P < 0.05 (*), 0.01 (**), 0.001 (***), 0.0001 (****) compared with CFA group; P < 0.05 (#), 0.01 (##), 0.001 (###), 0.0001 (####) compared with control group using one-way ANOVA with Dunnett t’s post hoc test. Ratios were compared using the Chi squared test.
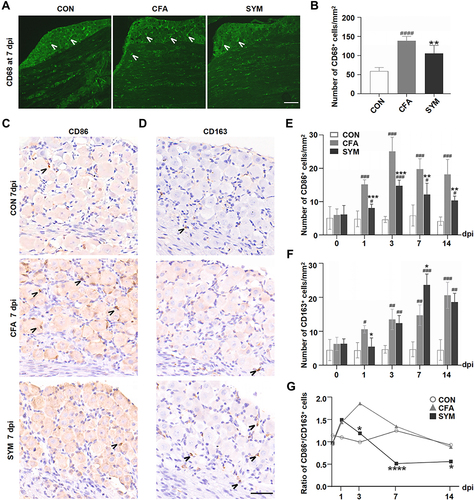
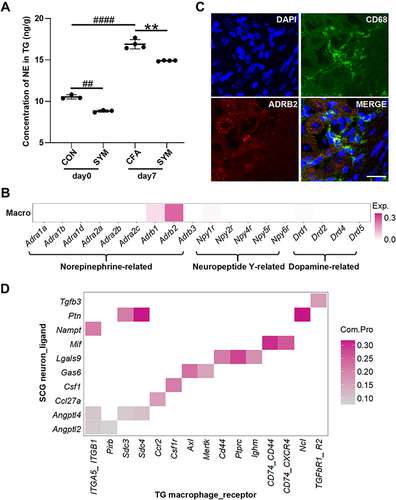
Figure 3 The distribution of receptors for sympathetic-released neurotransmitters in TG macrophage and the predicted sympathetic signaling to TG macrophage. Norepinephrine levels of TG were determined among control, CFA-injected and sympathetic-deprived CFA group before and 7 days after CFA injection, n = 6 per group (A). Receptors of norepinephrine, dopamine and neuropeptide Y expressed on TG macrophages based on the single cell sequencing dataset (GSE186421). Color intensity represents the average expression level of receptors (B). Double immunostaining revealed the co-localization of ADRB2 (red) and CD68 (green) in the TG, the nuclei were stained with DAPI (blue), merge shows the overlap of the signals (yellow); scale bar represents 20 μm (C). The communication possibility of a ligand and its receptor between SCG neuron and TG macrophage revealed by cell-cell communication analysis (D). P < 0.01 (**) compared with CFA group; P < 0.01 (##), 0.0001 (####) compared with control group using one-way ANOVA with Dunnett t’s post hoc test.