Figures & data
Table 1 Basic Characteristics of Patients
Figure 1 The effect of age on lymphocyte subsets. (A–C) The connection between CD4, CD8, CD19 lymphocyte counts, and BMI based on patients with ≤60. (D-F) The connection between CD4, CD8, CD19 lymphocyte counts, and tumor size based on patients with ≤60. (G–I) The connection between CD4, CD8, CD19 lymphocyte counts, and BMI based on patients with >60. (J–L) The connection between CD4, CD8, CD19 lymphocyte counts, and tumor size based on patients with >60. (M–O) The difference in CD4, CD8 and CD19 lymphocyte counts between ≤60 and >60 based on pTNM stage.
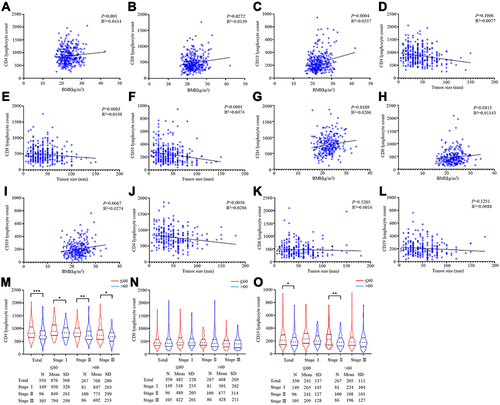
Figure 2 ROC curve of GSII, CD4, CD8, CD19 lymphocyte count among total patients. (A and B) ≤60 and >60 in training cohort. (C and D) ≤60 and >60 in validation cohort.
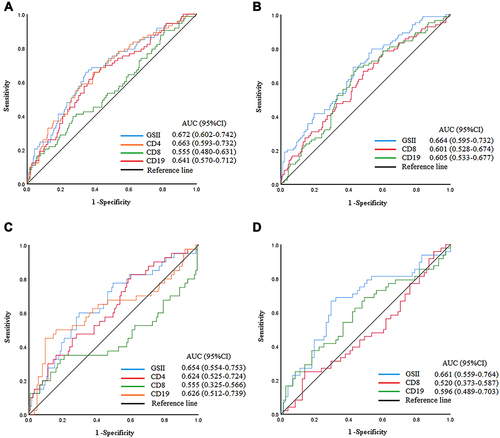
Table 2 Chi-Square Analysis of GSII and Patient Characteristics
Figure 3 Survival curve subgroup analyses of patients. (A–D) Survival curves of patients with ≤60 based on GSII in total stage, stage I, stage II and stage III in training cohort. (E–H) Survival curves of patients with >60 based on GSII in total stage, stage I, stage II and stage III in validation cohort. (I and J) Survival curves of patients with ≤60 and >60 based on GSII in overall patients in validation cohort.
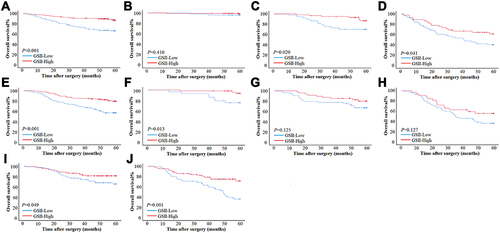
Figure 4 The impact of chemotherapy on prognosis in GSII-Low and GSII-High. (A and B) The effect of chemotherapy on patients who are less than 60 years old in GSII-Low and GSII-High in the training cohort. (C and D) The effect of chemotherapy on patients over 60 years old in GSII-Low and GSII-High in the training cohort. (E and F) The effect of chemotherapy on patients who are less than 60 years old in GSII-Low and GSII-High in the validation cohort. (G and H) The effect of chemotherapy on patients over 60 years old in GSII-Low and GSII-High in the validation cohort. (A, C, E and G) GSII-Low. (B, D, F, H) GSII-High.
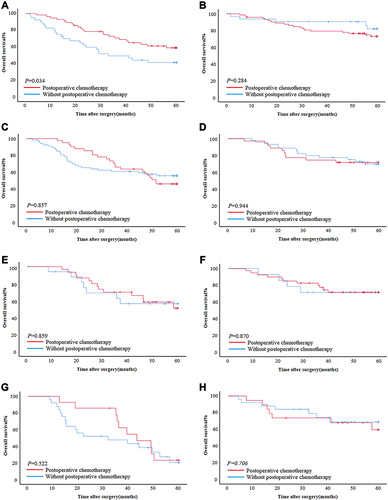
Table 3 Prognostic Factors of Patients with ≤60 by Univariate and Multivariate Analyses Based on Cox Regression Analysis
Table 4 Prognostic Factors of Patients with >60 by Univariate and Multivariate Analyses Based on Cox Regression Analysis
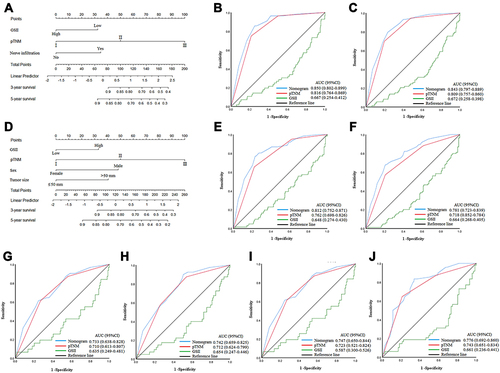
Figure 5 (A–C) Nomogram model predicting the 3- and 5-year survival of ≤60 in training cohort. (D–F) Nomogram model predicting the 3- and 5-year survival of >60 in training cohort. (G and H) Nomogram model predicting the 3- and 5-year survival of ≤60 in validation cohort. (I and J) Nomogram model predicting the 3- and 5-year survival of >60 in validation cohort.