Figures & data
Figure 1 General scheme of the concept of low doses (LD) and ultra-low doses (ULD) in the context of MI supported by the two cited preclinical research studies referring to the immune-stimulatory/anti-inflammatory responses elicited by the LD or ULD, respectively. LD of cytokines, ranging from 3 centesimal Hahnemannian (CH) to 5 CH, aim at orienting the immune responses towards an immune stimulation, inducing their own biological effect through mimicking the physiological low doses employed in the body. The immune-stimulatory effects of IFN-γ (4 CH) have been reported by Jacques et al 2022.Citation7 On the other side of the spectrum, ULD aim at modulating (from 6 CH)/down-regulating (from 12 CH and beyond) a response. For instance, the pro-inflammatory cytokines IL-1β and TNF-α employed at 27 CH, exerted anti-inflammatory responses (Floris et al 2020).Citation9 The CH numbers represented on the x-axis are the ones employed in the MIM’s formulations studied in the current manuscript. The arrows represent the direction of the oriented biological response mediated by the LD/ULD employed in micro-immunotherapy medicines (MIM). Green arrow, Stimulation of a biological response; Red arrow, Inhibition of a biological response; Combined Green and Red arrow, Modulation of a biological response.
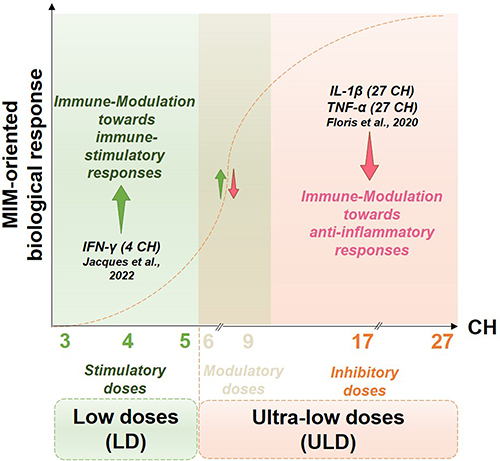
Figure 2 (A) The rationale of the present study is based on the fact that ULD of IL-1β and TNF-α are employed in the tested MI medicines (MIM). The anti-inflammatory role of these cytokines, when used at 27 CH, under the respective form of unitary MIM (u-MIM) has been reported by Floris et al 2020,Citation9 and Jacques et al 2021,Citation11 in a model of inflamed-immune cells (blue box) consisting of LPS-inflamed human primary monocytes and THP-1 cells. In the current study, the effects of these u-MIM were appraised in an intestinal model of inflammation (red box; see Results Section 1., for the results). (B) Scheme recapitulating the overall organization of the present manuscript regarding the four complex-MIM (c-MIM) studied. The formulation of each c-MIM is detailed. As each c-MIM formulation was tested in a particular context, the corresponding Results’ sections within this manuscript are reported at the bottom of each colored box (red box, intestinal inflammation model; blue box, inflamed-immune-cells model; yellow box, neuronal inflammation model). The arrows represent the direction of the oriented biological response mediated by the LD/ULD employed in micro-immunotherapy medicines (MIM). Green arrow, Stimulation of a biological response; Red arrow, Modulation/inhibition of a biological response; Combined Green and Red arrow, Modulation of a biological response; K, Korsakovian dilution.
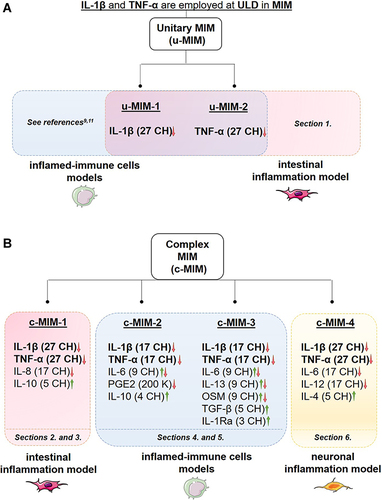
Figure 3 IL-1β (27 CH) and TNF-α (27 CH) tend to decrease the expression of both IL-1β and TNF-α at transcriptional levels, in a model of intestinal inflammation. (A) Representative scheme of the experimental protocol. HT-29 cells were pre-treated for 3 hours with 10 ng/mL TNF-α as an inflammatory trigger before the incubation with either the Veh., IL-1β (27 CH), or TNF-α (27 CH) during the next 24 hours. RT-qPCR analysis was performed at the end of the incubation period. (B and C) Expression of IL-1β and TNF-α at the transcriptional level, in presence of TNF-α (10 ng/mL) as an inflammation inducer and after a 24 hours incubation with either Veh., IL-1β (27 CH) or TNF-α (27 CH). The experiment has been done once and the means ± SD of three technical replicates are illustrated on the graph. The expression of glyceraldehyde-3-phosphate dehydrogenase (GAPDH) was used as an internal normalizer. The black dotted lines highlight the effect of the two tested u-MIM compared with the Veh.
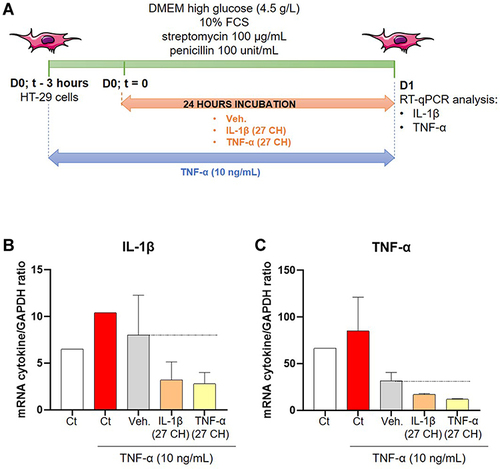
Figure 4 C-MIM-1 displays a protective effect against intestinal permeability in a model of intestinal cells inflamed with phytohemagglutinin (PHA)-stimulated PBMCs supernatants (SN). (A) Representative scheme of the experimental protocol. In the upper panel, the production of the PHA-stimulated peripheral blood mononuclear cells (PBMCs) supernatants (SN) is illustrated. The lower panel shows the evaluation of the effect of c-MIM-1 on the transepithelial electrical resistance (TEER) in a model of HCoEpiC cells. FCS, fetal calf serum; HBSS, Hanks’ balanced salt solution. Briefly, PBMCs from healthy adult volunteers’ donors were isolated by Ficoll-Hypaque density gradients and the cells were seeded in 24-well round-bottom plates and stimulated with PHA (5 µg/mL) for 48 hours. At the end of the incubation period, the SN containing pro-inflammatory cytokines were harvested. In parallel, HCoEpiC cells were grown in 24-well plate inserts until tight confluence. Cells were either not treated (Ct), treated with Veh. or treated with c-MIM-1 for 30 min before media replacement with either regular DMEM media or PHA-stimulated PBMCs SN during the next 24 hours or 72 hours. 30 minutes before the TEER measurement, the media was replaced with HBSS without phenol red alone in the basolateral area, in the apical chamber. Each condition has been measured in 3 individual wells (n = 3) and a condition in which C10 alone was incubated was used as a positive control for the induction of the epithelial disruption. (B and C) Effect of c-MIM-1 on HCoEpiC TEER after 24 or 72 hours of stimulation with PHA-induced PBMCs SN. Raw data were provided as the measures of the Ω/cm² for each triplicate, and were then expressed as percentages of the control conditions, set as 100%. Each histogram illustrating the mean ± SD obtained for each assessed condition, in 3 independent experiments. The black dotted lines highlight the effect of c-MIM-1 compared with Veh.
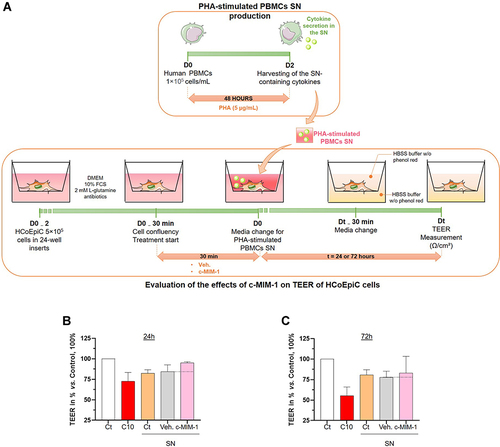
Figure 5 C-MIM-1 slightly increases the expression of claudin-1 in a cellular model of intestinal inflammation. (A) The expression of claudin-1 was assessed by RT-qPCR in the HCoEpiC cells, after 24 hours of treatment with either the Veh. or c-MIM-1 and stimulation with the supernatant (SN) from PBMCs treated with PHA (5µg/mL) for 30 min. The claudin-1 expression has been normalized by the one of the housekeeping gene GAPDH, and the control conditions, without any treatment, have been set at 1. The experiment has been done once; each condition was performed in triplicate. (B) The relative expression of claudin-1 at protein level has been assessed by Western Blot in the same cellular conditions as above. The expression of β-actin has been used as a housekeeping gene for the protein expression. The claudin-1/β-actin ratios are presented in PHA-stimulated PBMCs SN conditions, respectively, after quantization of the Blot’s pictures, using the online ImageJ software (downloaded on the 2nd of May 2022). The Western Blots were run twice and the mean ratios ± SD obtained from each Blot are shown. The black dotted lines highlight the effect of c-MIM-1 compared with Veh.
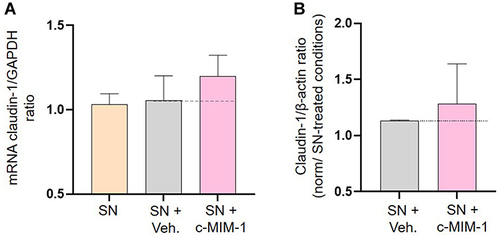
Figure 6 C-MIM-2 diminished the secretion of pro-inflammatory cytokines in human primary monocytes. (A) Experimental scheme for the cytokines secretion assessment in presence of c-MIM-2. Human primary monocytes were treated during 24 hours with either Veh. or c-MIM-2. LPS (10 ng/mL) was added to the medium 30 minutes after the treatment initiation, as an induced or the inflammatory conditions. The levels of secreted (B and C) TNF-α and (D and E) PGE2 were assessed in the culture media at the end of the incubation time by ELISA assay. The results are presented as the mean percentage ± SD of the values obtained for each donor. Each condition was performed in triplicate for each donor (3 donors) and in duplicate for the LPS conditions. The results are presented either as a percentage of the Ct (-) secretion or as a percentage of the Veh. secretion (set at 100%). The black dotted lines highlight the effect of c-MIM-2 compared with Veh.
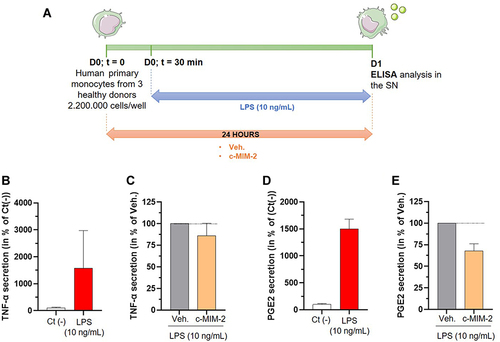
Figure 7 C-MIM-3 modulated the secretion of pro-inflammatory cytokines in immune cells. (A) Experimental scheme for the cytokine secretion assessment in presence of c-MIM-3. Human primary monocytes were differentiated into macrophages during 6 days and were then treated during 24 hours or during 48 hours with either Veh. or c-MIM-3. LPS (100 ng/mL) was added to the medium at the same time, as an inducer or the inflammatory conditions. The secreted levels of IL-6 were measured by ELISA assay after (B and C) 24 hours or (D and E) 48 hours. The results are presented as the mean percentage ± SD of the values obtained for each triplicate per condition (n = 6 for the LPS conditions). The untreated negative control (Ct (-)) or the Veh. conditions are set at 100%. (F) Experimental scheme for the IL-6 secretion assessment in presence of c-MIM-3. Human primary granulocytes freshly isolated from one healthy donor were seeded in 48-wells plates and pre-incubated during one hour in presence of either the Veh. or c-MIM-3. LPS (1 µg/mL) was then added to the medium, as an inducer of the inflammatory conditions. The secreted levels of IL-6 were measured by CBA 18 hours later. The secreted levels of IL-6 were evaluated after stimulation with LPS alone (G), and in presence of either the Veh. or c-MIM-3 (H). The results are presented as the mean percentage ± SD of the values obtained for each triplicate. For each panel, the black dotted lines highlight the effect of c-MIM-2 and c-MIM-3 compared with Veh.
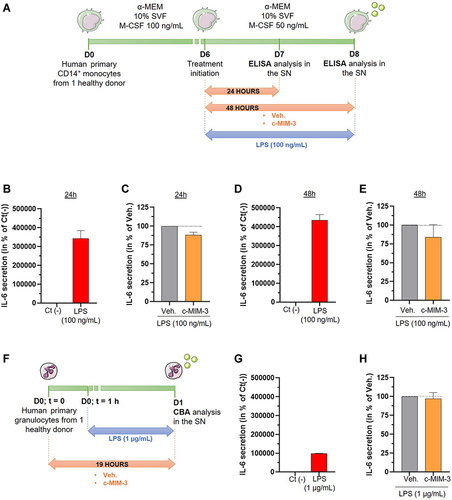
Figure 8 C-MIM-4 displays anti-inflammatory effects in a cellular model of neuronal inflammation. (A) Representative scheme of the experimental protocol. Briefly, rat glial cells (astrocytes/microglial cells) and rat cortical neurons were co-cultured during 8 days before treatment initiation with either Veh., c-MIM-4, or MK801 (20 µM). The treatments were applied for 24 hours, before adding or not LPS (100 ng/mL)/IFN-γ (10 ng/mL) for an additional 24 hours. At this time, supernatants (SN) were harvested and frozen for further ELISA analysis. The tested items ± LPS/IFN-γ were incubated another 48 hours before neurons survival analysis. The latter was performed after cell fixation, permeabilization and staining with a monoclonal anti-microtubule associated protein 2 (MAP-2) antibody, specific towards neuron cell bodies and neurites. Images of each culture wells were taken and the fluorescence was quantified. BDNF, brain-derived neurotrophic factor; FCS, fetal calf serum; PS, penicillin – streptomycin. (B) Effect of a 96 hours c-MIM-4 treatment on rat primary cortical neurons survival, in presence of LPS (100 ng/mL)/IFN-γ (10 ng/mL), expressed in percentage of control medium. The results are presented as the mean ± SD of n = 6 technical replicates. (C) Effect of a 48 hours treatment by c-MIM-4 on TNF-α release by astrocytes and microglial cells, expressed as percentages of control medium (mean ± SD of n = 6 technical replicates). In this experiment, the cells were pre-incubated during 24 hours with either Veh., c-MIM-4 or MK801, then LPS (100 ng/mL)/IFN-γ (10 ng/mL) was added for an additional 24 hours. The black dotted lines highlight the effect of c-MIM-4 compared with the Veh.
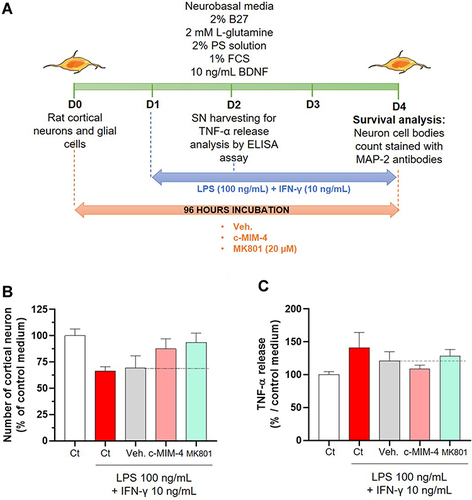
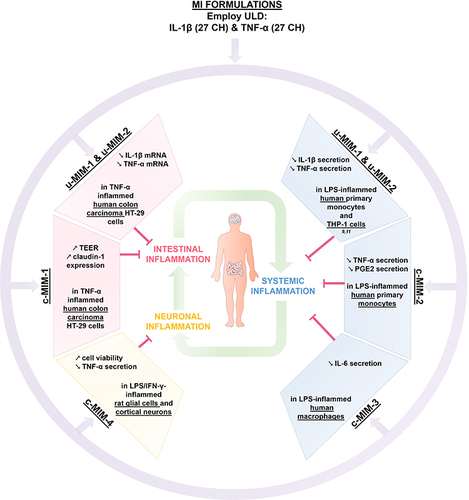
Figure 9 Recapitulative scheme about the anti-inflammatory effects of IL-1β and TNF-α, when employed at ULD in MI medicines formulations. The two unitary medicines IL-1β (27 CH) and TNF-α (27 CH) (u-MIM-1, and −2, respectively), as well as the four MI complex formulations (c-MIM-1, −2, −3, and −4) display anti-inflammatory properties in the context of (i) intestinal inflammation (red box), (ii) inflamed-immune cells related to systemic inflammation (blue box), and (iii) neuronal inflammation (yellow box) contexts. Purple arrows illustrate the fact that IL-1β and TNF-α are included into MI formulations, either in u-MIM or in c-MIM. Green arrows illustrate the interconnexions between the different inflammatory contexts (i), (ii) and (iii).