Figures & data
Table 1 Relevant Information of the Clinical Samples from AH Patients
Figure 1 (A) H&E staining was used to detect the pathological state of the adenoids of AH patients. (B) IHC based detection of the expressions of CD86, CD206, IL-17A and FOXP3.
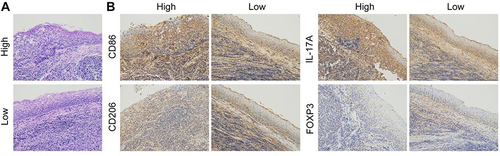
Figure 2 (A and B) Detection of polarization of macrophages by IF.
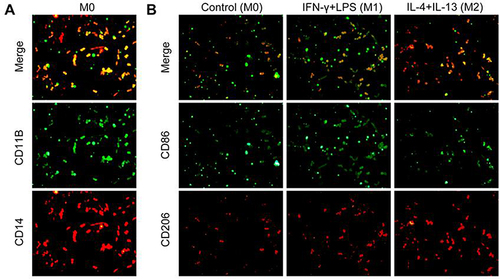
Figure 3 (A) CCK-8 assay for identifying the proliferation of lymphocytes. (B) IF mediated detection of the expressions of CD4, IL-17 and FOXP3. (C) Detection of the levels of IL-17, IL-10 and TGF-β by ELISA. *P<0.05, **P<0.01, ***P<0.001 vs control; #P<0.05, ###P<0.001 vs M0. All experiments were performed in triplicate and the data are presented as mean ± SD.
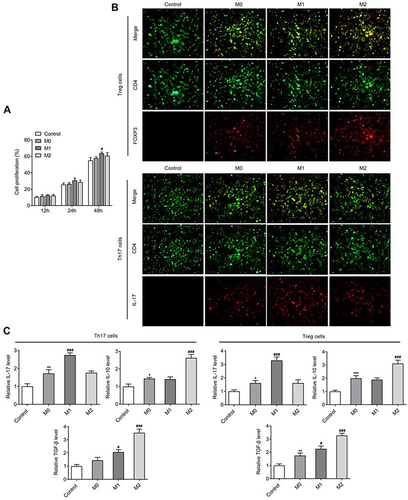
Figure 4 (A) CCK-8 assay for identifying the proliferation of adenoid epithelial cells. (B) Detection of the levels of IL6, TNF-α, IL-1β and CCL20 by ELISA. *P<0.05, **P<0.01 vs control; #P<0.05, ##P<0.01, ###P<0.001 vs M0; ΔP<0.05, ΔΔP<0.01, ΔΔΔP<0.001 vs M1. All experiments were performed in triplicate and the data are presented as mean ± SD.
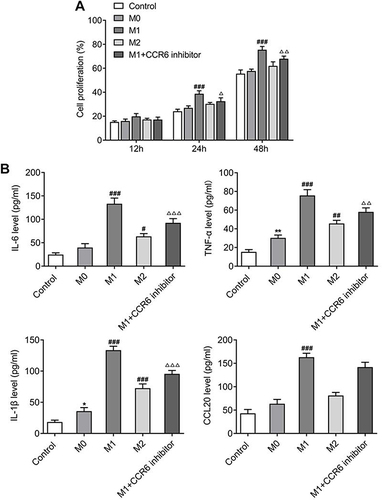
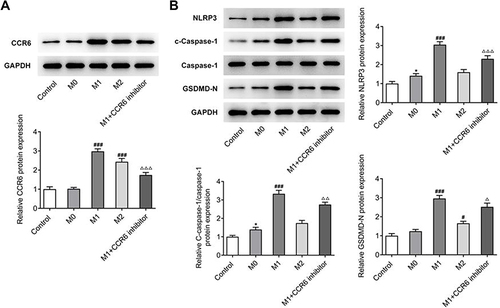
Figure 5 (A) Detection of the expression of CCR6 by Western blot. (B) Detection of the expression of inflammation related proteins by Western blot. *P<0.05 vs control; #P<0.05, ###P<0.001 vs M0; ΔP<0.05, ΔΔP<0.01, ΔΔΔP<0.001 vs M1. All experiments were performed in triplicate and the data are presented as mean ± SD.