Figures & data
Figure 1 Gene expression changes in gastritis-cancer transformation. (A) DEGs obtained by comparing NAG, AG and CA with HC, respectively. (B) Overlap analysis between DEGs from different stages. (C) Staged DEGs in NAG. (D) Staged DEGs in NAG. (E) Staged DEGs in CA.
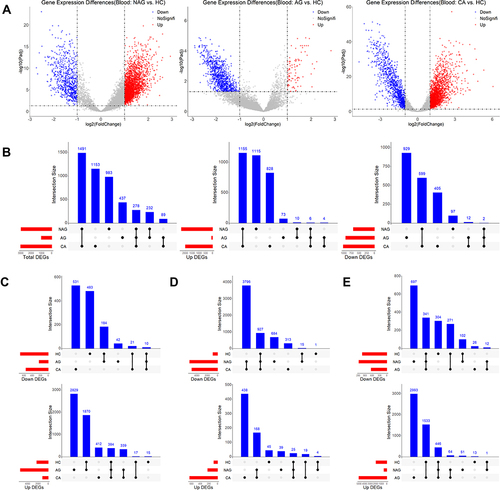
Figure 2 Screening of core genes at each stage. (A) Construction of weighted gene co-expression network and division of co-expression modules. (B) Screen for genes at core positions in co-expression modules. (C) The intersection of staged DEGs and genes at core positions was regarded as core genes.
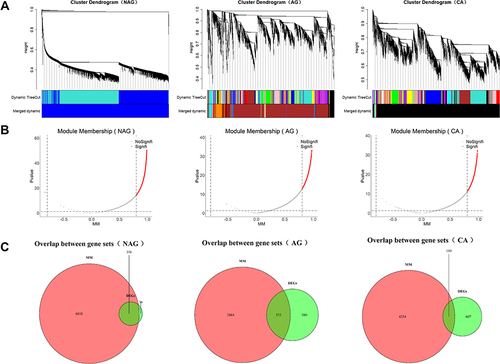
Figure 3 Functional enrichment analysis of the core genes of NAG. (A–C) Functional description of the core genes of NAG in BP, CC, and MF. (D) Pathways involved in core genes of NAG.
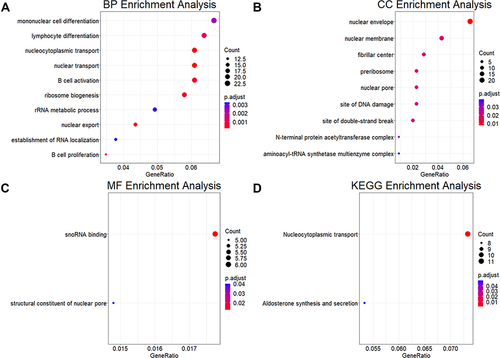
Figure 4 Screening of genes with diagnostic potential. (A–C) The discriminative ability of genes in NAG, AG and CA for corresponding stage samples was analyzed by ROC curve. (D and E) The expression of the top 20 genes ranked by AUC value in AG and CA.
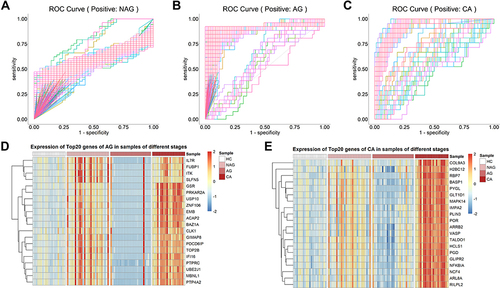
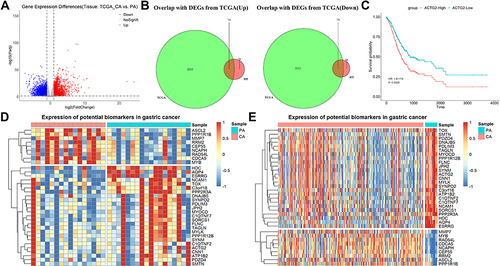
Figure 5 Gene expression features and core gene mining in GC tissues. (A) DEGs obtained by comparing CA with PA. (B) Construction of weighted gene co-expression network and division of co-expression modules. (C) Screen for genes at core positions in co-expression modules. (D) The intersection of DEGs and genes at core positions was regarded as core genes.
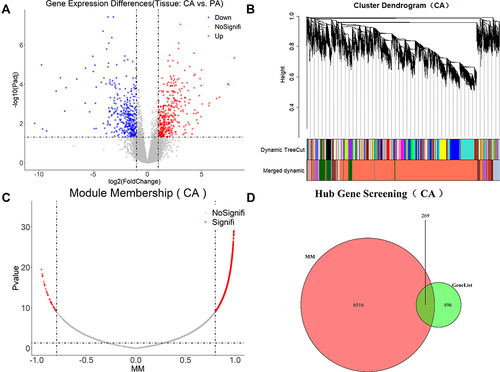
Figure 6 Functional enrichment analysis of the core genes of CA tissue samples. (A–C) Functional description of the core genes of CA tissue samples in BP, CC, and MF. (D) Pathways involved in core genes of CA tissue samples.
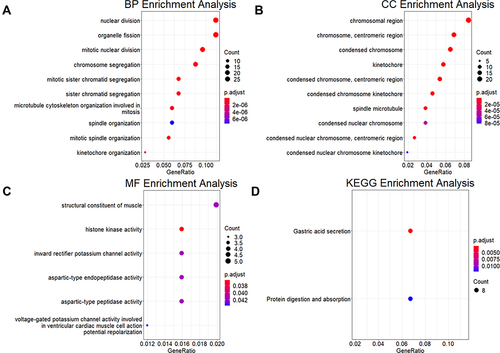
Figure 7 Combined transcriptome data in TCGA to identify potential biomarkers of GC. (A) DEGs obtained by comparing CA with PA in TCGA. (B) Screening of genes with consistent differential changes in the two datasets. (C) Association between genes and survival in GC patients. (D and E) Expression of potential biomarkers in self-collected datasets and TCGA datasets.