Figures & data
Figure 1 Effect of zinc on Tregs and Th17 cells in MLC. The cells were adjusted as 2×10⁶ cells, next incubated with 50 μM zinc for 15 minutes preceding MLC generation, and following five days of MLC incubation, Tregs and Th17 cells% were analyzed by flow cytometry. Untreated cells (white bars) and cells incubated with 50 μM zinc (black bars) are represented in the graphs. (A) CD4+Foxp3+ T cells, p = 0.031 (B) CD25+Foxp3+ T cells, (p = 0.043) (C) CD4+RORC2+ T cells, (p = 0.083) (D) CD25+RORC2+ T cells, (p = 0.097). Results are presented as mean values ± SEM. *Significance (p < 0.05).
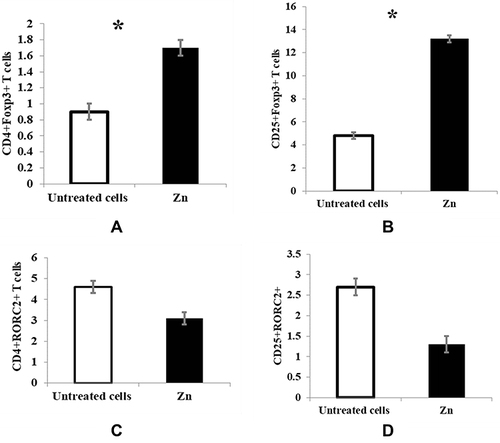
Figure 2 Effect of zinc supplementation on IFNγ, IL17 & IL10 production as measured by ELISA. Untreated restimulated T cells (white bars) and treated cells with 50μm zinc (black bars) are represented in the graphs. For each cytokine, (A, C, E) restimulated T cells with autologous PBMC & (B, D, F) Restimulated T cells with allogeneic PBMC. (A) p = 0.044. (B) p = 0.001. (C) p = 0.023. (D) p = 0.041. (E) p = 0.073. (F) p = 0.084. Results are presented as mean values ± SEM. *Significance (p < 0.05), **significance (p < 0.01).
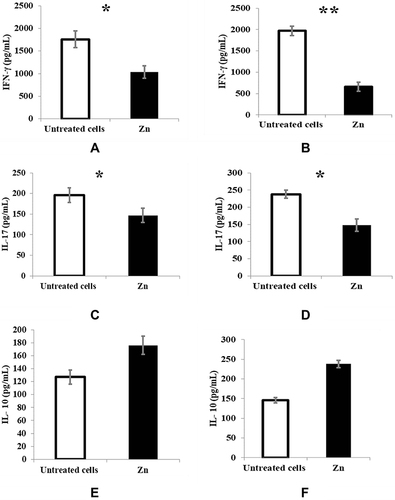
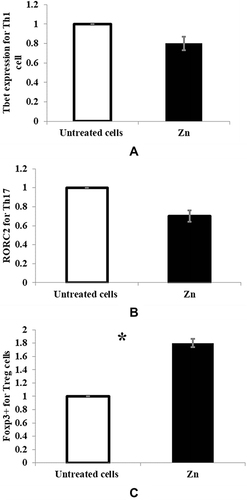
Figure 3 The mRNA expression of (A) Tbet for Th1 cell, p = 0.068 (B) RORC2 for Th17 cell, p = 0.075 and (C) Foxp3+ for Tregs, p = 0.018 were measured by real-time PCR. Untreated MLC (white bars) and treated cells with 50μm zinc (black bars) are represented in the graphs. *Significance of p < 0.05.