Figures & data
Figure 1 Establishment of an HFD/STZ-induced DN rat model.
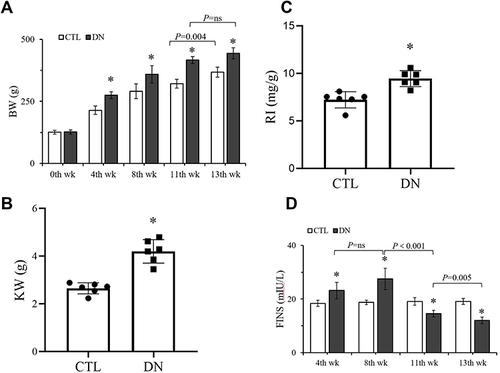
Figure 2 Continued.
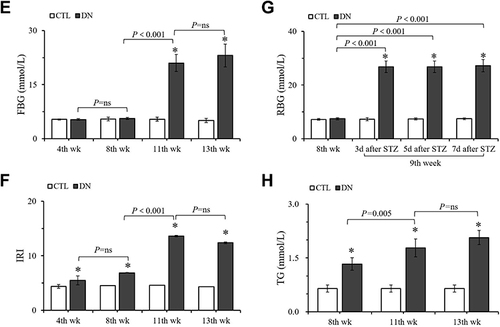
Figure 2 Biological parameters of the CTL group and the DN group at the different experimental weeks. (A) BW. (B) KW. (C) RI. (D) FINS. (E) FBG. (F) IRI. (G) RBG. (H) TG. (I) TC. (J) SCr. (K) BUN. (L) 24h-UP. (M) UCr. (N) CrCl. Data were presented as mean ± SD. *P < 0.05, vs the CTL group at the same week.
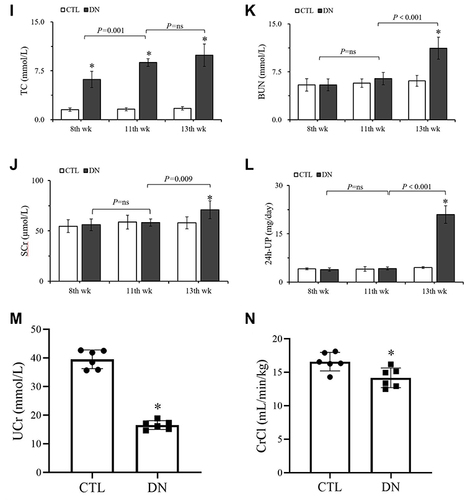
Figure 3 Comparison of TNF-α and IL-1β levels in serum and kidney tissue. (A) TNF-α levels in serum. (B) IL-1β levels in serum. (C) TNF-α levels in kidney. (D) IL-1β levels in kidney. Data are expressed as the mean ± standard deviation (n=6). *P < 0.05, vs the CTL group at the same week.
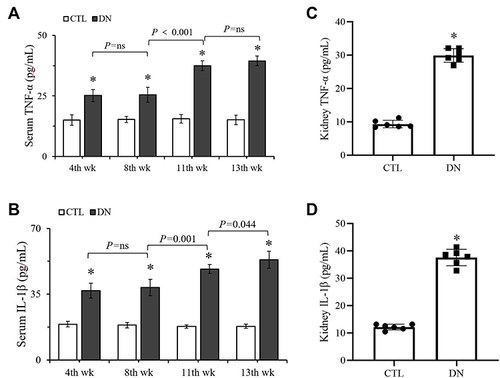
Figure 4 Continued.

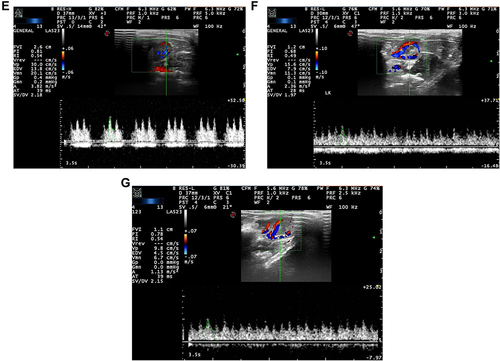
Figure 4 Evaluation of renal hemodynamics of left kidney by color Doppler spectrum ultrasound. (A) Schematic diagram of main artery, segmental artery and interlobar artery. (B) The main artery of the CTL group. (C) The main artery of the DN group. (D) The segmental artery of the CTL group. (E) The segmental artery of the DN group. (F) The interlobar artery of the CTL group. (G) The interlobar artery of the DN group. (H) Comparison of PSV, MV and EDV in the two groups. (I) Comparison of RI and PI in the two groups. All data were obtained from left kidney of rats. Data are expressed as the mean ± standard deviation (n=6). *P < 0.05, comparison in the main artery of the CTL group and the DN group. #P < 0.05, comparison in the interlobar artery of the CTL group and the DN group.
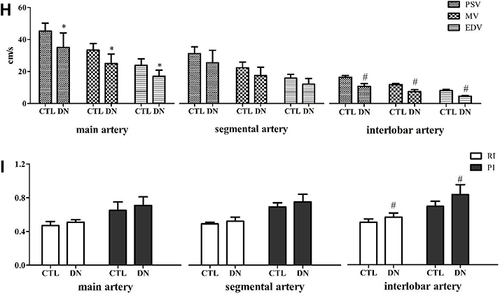
Figure 5 Histological results with light microscopy (×400). (A) Glomerulus of the CTL group. (B) Glomerulus of the DN group. (C) Comparison of the glomerular diameter. (D) Comparison of the relative area of mesangial. All data were obtained from left kidney of rats. Data are expressed as the mean ± standard deviation (n=6). *P < 0.05, vs the CTL group.
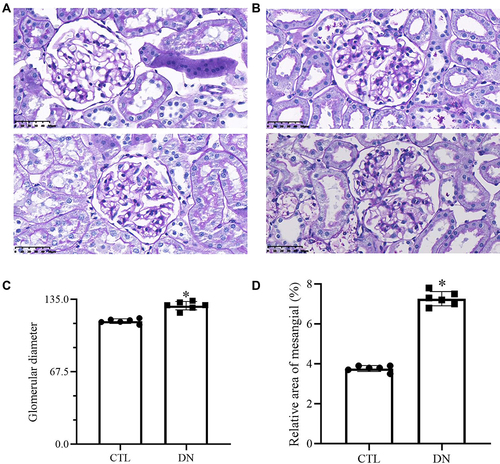
Figure 6 Comparison of Nephrin, WT-1, TNF-α, IL-1β, eNOS and VEGF mRNA expression levels of kidney. (A) Nephrin expressions. (B) WT-1 expressions. (C) TNF-α expressions. (D) IL-1β expressions. (E) eNOS expressions. (F) VEGF expressions. Data are expressed as the mean ± standard deviation (n=6). *P < 0.05, vs the CTL group.
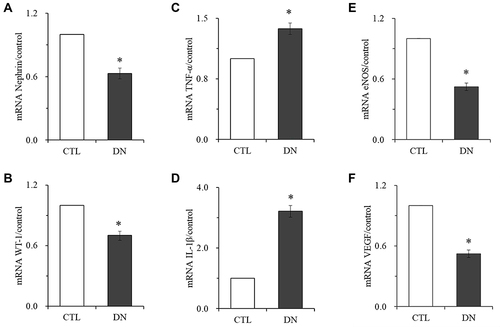
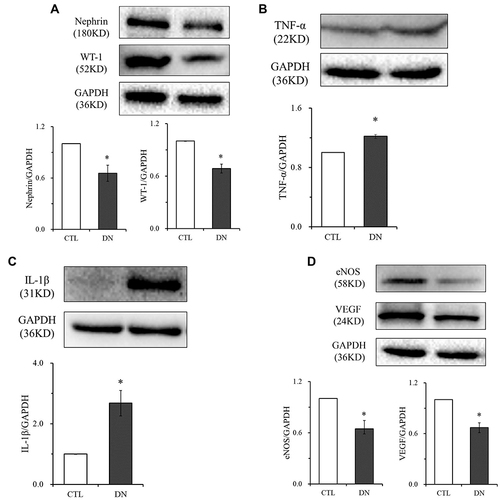
Figure 7 Comparison of Nephrin, WT-1, TNF-α, IL-1β, eNOS and VEGF protein expression levels of kidney. (A) Nephrin and WT-1 expressions. (B) TNF-α expressions. (C) IL-1β expressions. (D) eNOS and VEGF expressions. Data are expressed as the mean ± standard deviation (n=6). *P < 0.05, vs the CTL group.