Figures & data
Figure 1 Systemic and behavioral assessment of mice. Spleen weight index (A), Serum anti-dsDNA antibody level (B), The percentage of immobility duration in forced swimming experiment (C), Total distance of mice in the OFT (D), The percentage of mice spend in the central region (E), The percentage of the length of movement of mice in the central region (F).
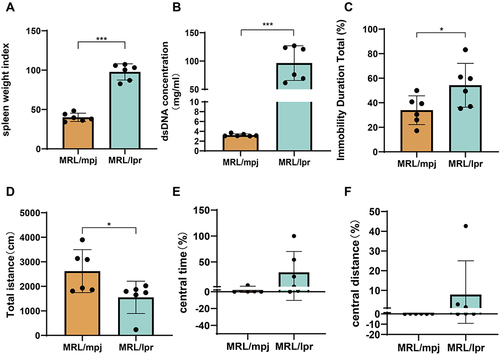
Figure 2 Analysis of hippocampal tissue lipidomic results. PCA analysis (A), PLS-DA analysis (B), permutation test plot (C), Pie chart of differential lipids (D), Clustering heat map analysis of differential lipids (E).
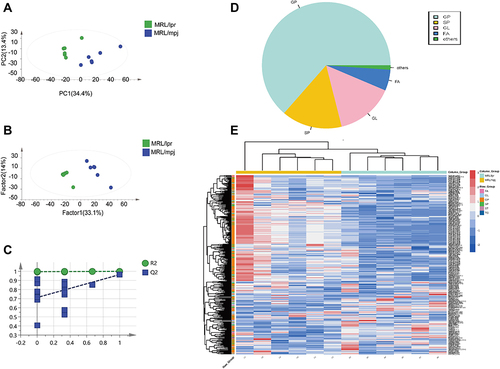
Figure 3 Analysis of liver tissue lipidomic results. PCA analysis (A), PLS-DA analysis (B), permutation test plot (C), Pie chart of differential lipids (D), clustering heat map analysis of differential lipids (E).
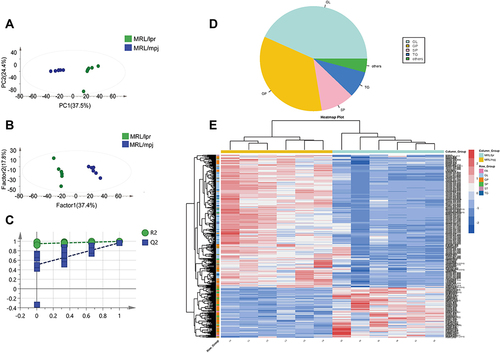
Figure 4 Pathway enrichment results. Hippocampal significantly enriched pathways (A), Liver significantly enriched pathways (B), Venn diagram of differential lipids in two tissues (C).
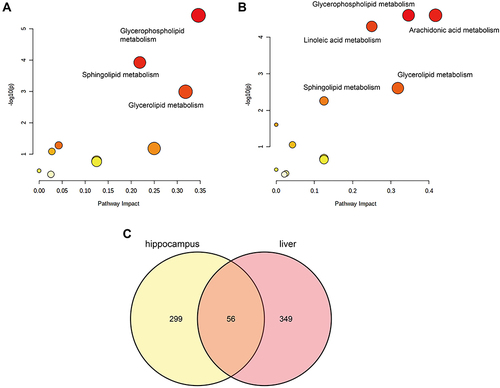
Figure 5 The map of Pathways significantly enriched in both tissues. Metabolites altered in the pathway are in blue.
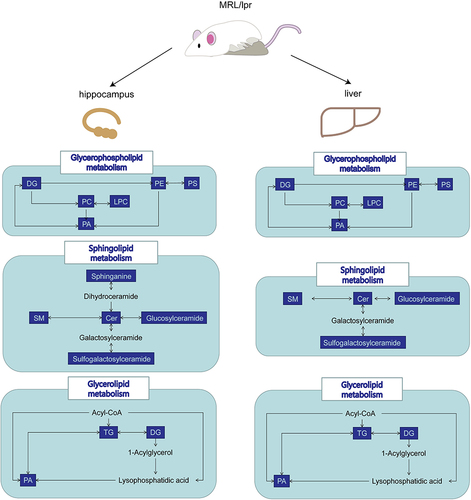
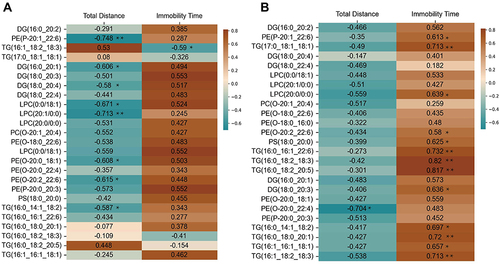
Table 1 Common Differential Lipid Metabolites with the Same Tendency in the Two Tissues
Figure 6 Correlation analysis of these 25 lipids with behavioral phenotypic indices in mice. Correlation analysis of metabolites in the hippocampus (A), Correlation analysis of metabolites in the liver (B). Immobility time and the total distance are indicators of depression-like behavior in mice, and the numbers are correlation coefficients and the p values are shown with * and **.