
Figures & data
Table 1 Summary of Patient Characteristics and the Methods
Table 2 Summary of Cilia Length and DNAI1 Expression Patterns Statistics in vivo
Figure 1 Shorter cilia length in patients with AR compared with control individuals. (A and B) Positive staining of cilia by acet.α-tubulin in patients with AR compared with control individuals under 400× magnification, scale bar 20 µm. Green – acet.α-tubulin, blue – DAPI. (C) Shorter cilia length in patients with AR compared with control individuals. Median and first and third quartile values are indicated by the scale bar. (D) A higher proportion of shorter cilia length distribution in patients with AR.
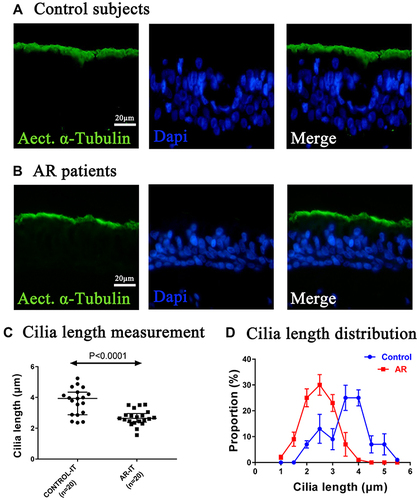
Figure 2 Three location patterns of DNAI1 expression and evaluated scores. (A) Three patterns of DNAI1 localization, normal, N; partial, P; absence, A, were observed in both control and AR groups under 400× magnification, scale bar 20 µm. (B–D) Semi-quantitative scoring system was used in five areas per paraffin section. Every individual section was assigned a score between 0 and 2.
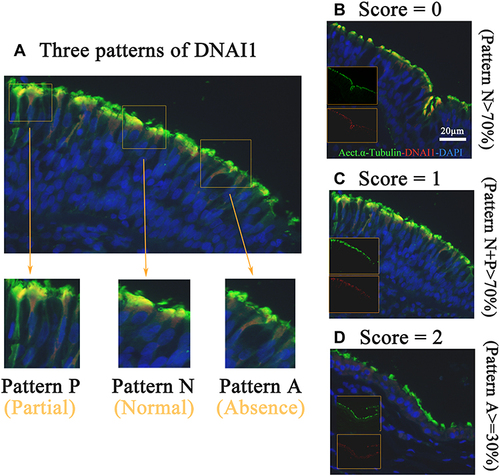
Figure 3 Score and ROC evaluation of DNAI1 for AR. (A) Higher DNAI1 score in patients with AR compared with control individuals. Median and first and third quartile values are indicated by the scale bar. (B) Predictive ability was calculated based on the AUC. DNAI1 score had an AUC of 0.74 and P = 0.0094. The cutoff value was 0.5833, and sensitivity and specificity were 70%.
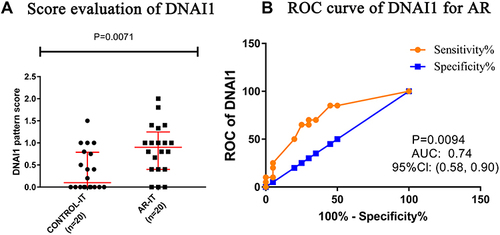
Table 3 Sensitivity and Specificity at Different Cutoff Points of DNAI1 Score for AR