Figures & data
Figure 1 Chest radiograph sign in pulmonary window and mediastinal. (A) Air bronchial sign. (B) Single cavity. (C) Multiple cavities.
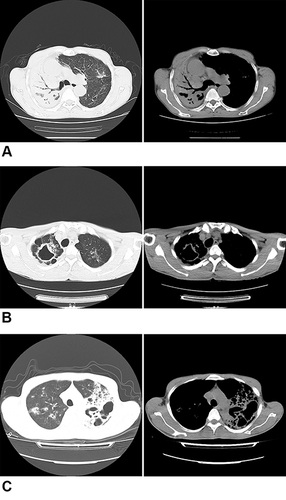
Table 1 General Characteristics and Clinical Parameters of Cases and Controls
Table 2 Association of DNA Methylation Level of Candidate Genes and Risk of TB-DM
Figure 2 Methylation analyses of CpG islands of key genes promoter in patients with TB-DM and health subject. (A) Methylation analyses of two CpG islands of the VDR promoter in Peripheral blood mononuclear cells (PBMCs) from patients and Health subject. (B) Methylation analyses of two CpG islands of the DHCR7 promoter in Peripheral blood mononuclear cells (PBMCs) from patients and Health subject. (C) Methylation analyses of one CpG islands of the CYP27B1 promoter in Peripheral blood mononuclear cells (PBMCs) from patients and Health subject. (D) Methylation analyses of four CpG islands of the CYP27A1 promoter in Peripheral blood mononuclear cells (PBMCs) from patients and Health subject. (E) Methylation analyses of two CpG islands of the CYP2R1 promoter in Peripheral blood mononuclear cells (PBMCs) from patients and Health subject (*p < 0.05, **p < 0.01, ***p < 0.001, ****p < 0.0001, and ns refers to no significant).
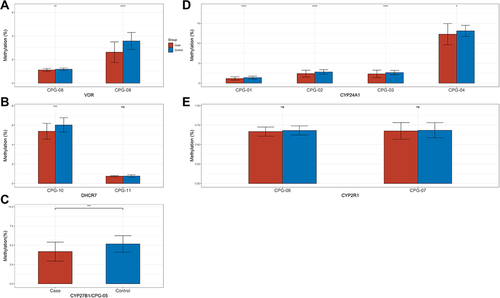
Figure 3 The overall methylation of candidate genes promoter in patients with TB-DM and health subject. (A) CYP24A1; (B) CYP27B1; (C) CYP2R1; (D) DHCR7; (E) VDR (***p < 0.001, and ns refers to no significant).
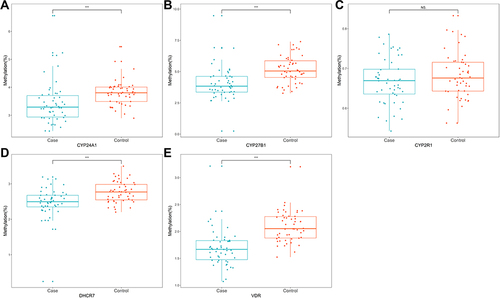
Table 3 Diagnostic Values of Genes for TB-DM
Figure 4 The ROC curve of the methylation levels of candidate genes.
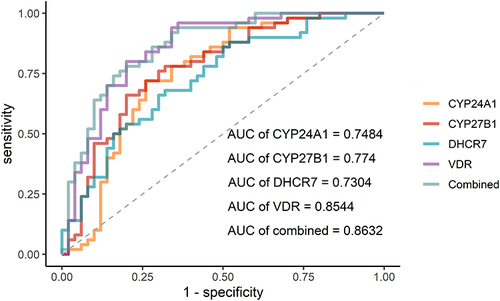
Table 4 Methylation Levels of Genes in TB-DM According to Vitamin D Status
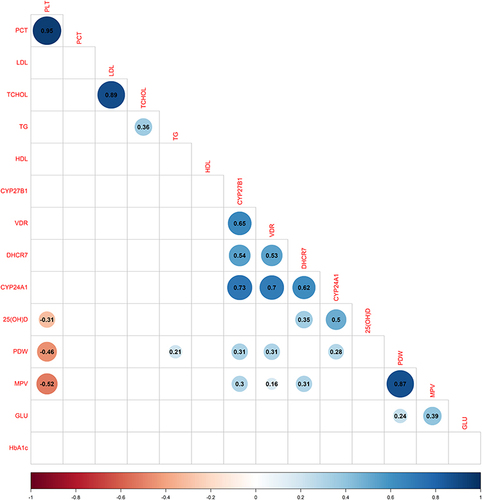
Figure 5 Corrplot of studied correlation of methylation level of key genes in vitamin D metabolic pathway and with biochemical parameters in TB-DM. Blue colour represents positive correlation; red colour represents negative correlation; darker colors and larger shapes represent higher association. Blank represents no statistical difference.