Figures & data
Table 1 Baseline Demographics & Clinical Characteristics of Study Population
Table 2 Demographics & Clinical Characteristics According to NLR, PLR and LMR in the Training Cohort
Table 3 Demographics & Clinical Characteristics According to SMI Score in the Training Cohort
Figure 1 The Kaplan-Meier analysis of RFS stratified by (A) NLR, (B) PLR, (C) LMR; and the Kaplan-Meier analysis of PFS stratified by (D) NLR, (E) PLR, (F) LMR in the training cohort.
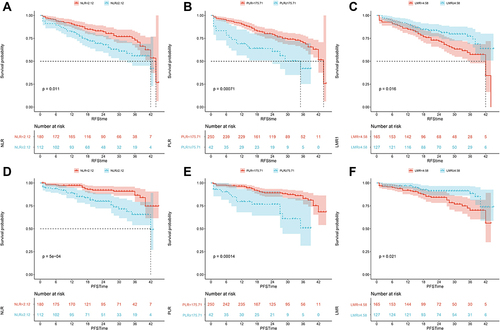
Figure 2 The Kaplan-Meier analysis of (A) RFS and (B) PFS stratified by SIM score in the training cohort.
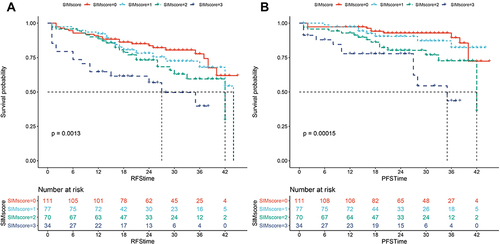
Table 4 Univariable and Multivariable Analysis for Predicting Recurrence-Free Survival
Table 5 Univariable and Multivariable Analysis for Predicting Progression-Free Survival
Figure 3 (A) The nomogram for predicting RFS after TURBT for NMIBC. (B) Time-dependent ROC curves of the nomogram for predicting RFS in the training cohort. (C) Calibration plot of the nomogram by bootstrapping with 1000 resamples for predicting RFS in the training cohort. (D) Decision-curve analyses demonstrating the net benefit associated with the use of the model for predicting RFS.
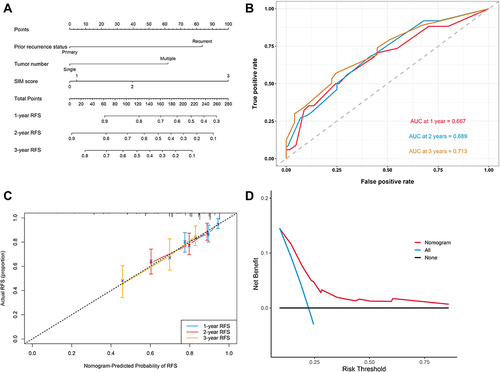
Figure 4 (A) The nomogram for predicting PFS after TURBT for NMIBC. (B) Time-dependent ROC curves of the nomogram for predicting PFS. (C) Calibration plot of the nomogram by bootstrapping with 1000 resamples for predicting PFS. (D) Decision-curve analyses demonstrating the net benefit associated with the use of the model for predicting PFS.
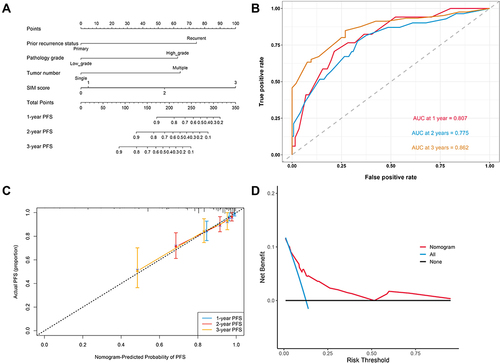
Figure 5 (A) Time-dependent ROC curves of the nomogram for predicting RFS in the validation cohort in the validation cohort. (B) Calibration plot of the nomogram by bootstrapping with 1000 resamples for predicting RFS in the validation cohort in the validation cohort. (C) Time-dependent ROC curves of the nomogram for predicting PFS in the validation cohort in the validation cohort. (D) Calibration plot of the nomogram by bootstrapping with 1000 resamples for predicting PFS in the validation cohort in the validation cohort.
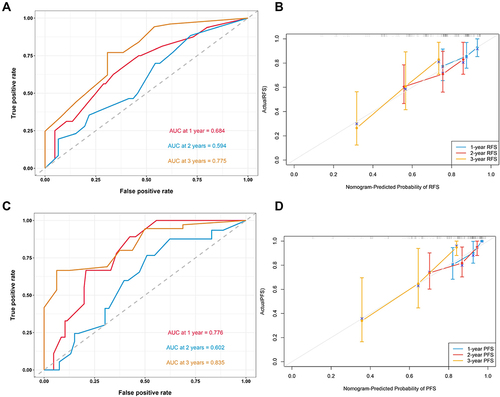
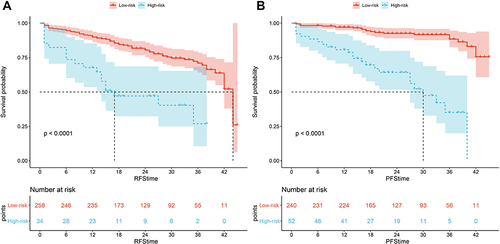
Figure 6 The Kaplan-Meier curves of low-risk and high-risk groups based on the prediction of the nomogram models for (A) RFS and (B) PFS.