Figures & data
Figure 1 The flow chart of study subject enrollment.
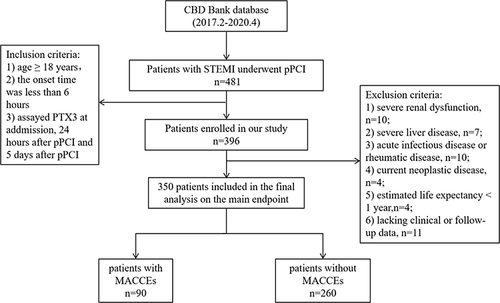
Table 1 Baseline Characteristics of Patients with and without MACCEs
Figure 2 Dynamical change of PTX3 concentration at admission, 24 hours after pPCI and 5 days after pPCI in STEMI patients with and without MACCEs. #P < 0.05 vs at admission.
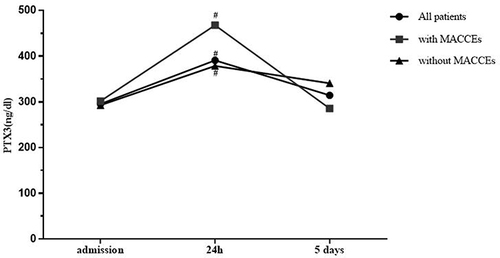
Figure 3 Correlation between ΔPTX3 and peak NT-proBNP (A), LVEF (B), Syntax score (C), GRACE score (D) and TIMI score (E).
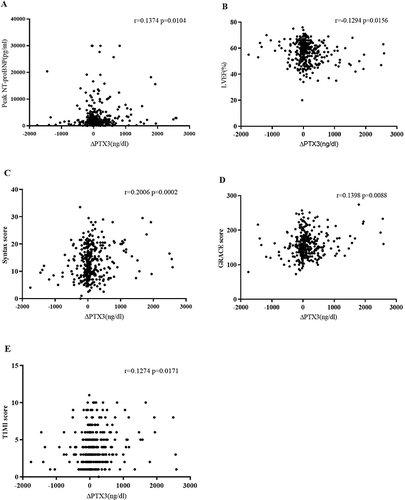
Figure 4 The receiver operating characteristic (ROC) curve of the ΔPTX3 as a marker to predict MACCEs.
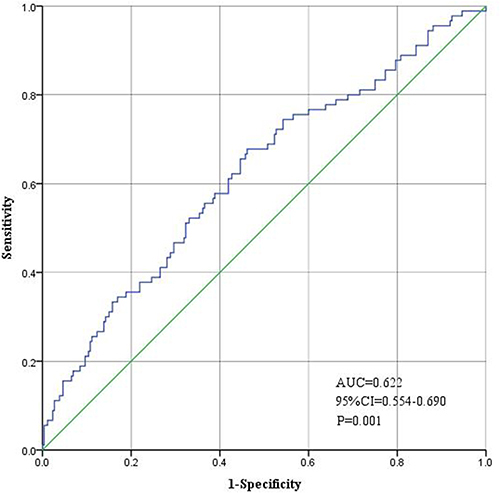
Table 2 Univariate and Multivariate Cox Regression Analysis of MACCEs in All Patients
Table 3 Clinical Events in Low ΔPTX3 Group and High ΔPTX3 Group During 1-Year Follow-Up
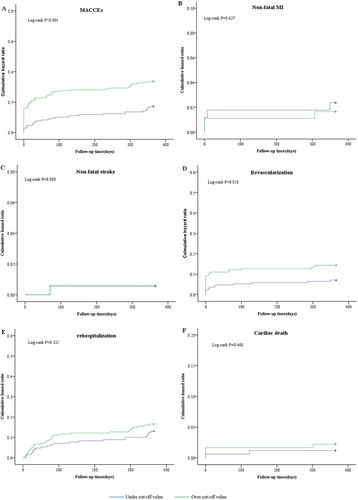
Figure 5 Kaplan–Meier curves for MACCEs (A), non-fatal MI (B), non-fatal stroke (C), revascularization (D), cardiac rehospitalization (E) and Cardiac death (F) of the ΔPTX3≥29.22 ng/dl group (green line) versus the ΔPTX3<29.22 ng/dl group (blue line).