Figures & data
Figure 1 Expression and prognostic analyses of CLRs in HCC tissue and normal tissue data from TCGA. (A) Comparative analysis of mRNA expression of CLRs between HCC tissue and normal tissues. (B) IHC results from the HPA database showing the protein expression of Dectin-3 and Mincle in normal tissues and HCC tissues. (C) CLR promoter methylation levels in normal tissue and HCC tissue. (D) Kaplan‒Meier curves for overall survival according to the expression of CLRs. ****p < 0.0001.
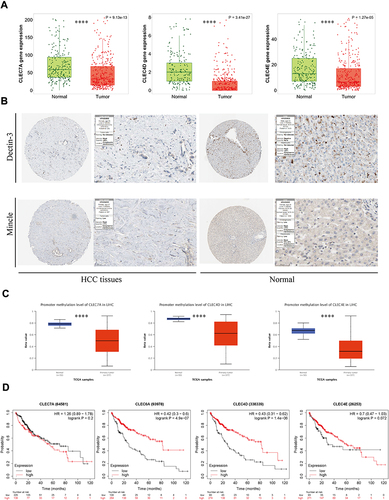
Figure 2 Enrichment analysis revealed the potential biological mechanisms of CLRs. (A) Volcano map of the DEGs and the results of Gene Ontology (GO) and Kyoto Encyclopedia of Genes and Genomes (KEGG) analyses of the DEGs of the high and low Dectin-1 expression groups based on TCGA data. (B) Volcano map of the DEGs and the results of GO and KEGG analyses of the DEGs of the high and low Dectin-3 expression groups based on TCGA data. (C) Volcano map of the DEGs and the results of GO and KEGG analyses of the DEGs of the high and low Mincle expression groups based on TCGA data.
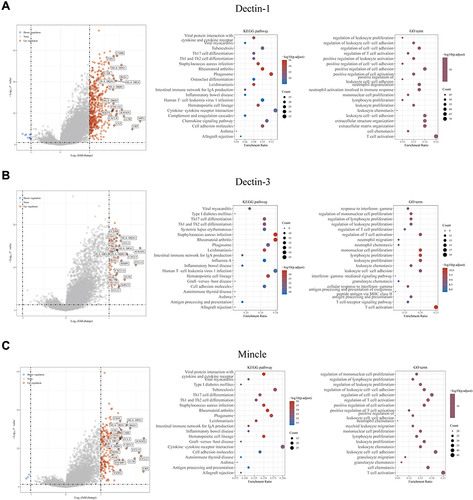
Figure 3 Associations of CLR expression with the levels of infiltrating immune cells in HCC. (A) Associations between CLR expression and the levels of several crucial infiltrating immune cells in HCC, including B cells, CD8+ T cells, CD4+ T cells, macrophages, neutrophils and dendritic cells. (B) Relationship between CLR expression and IL-1 and IL-17 expression in HCC.
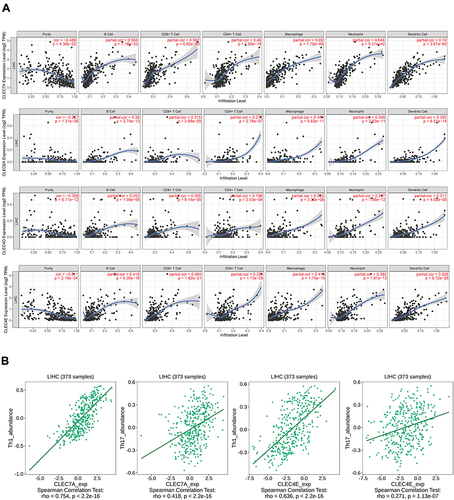
Figure 4 Expression of immune checkpoint proteins and prediction of response to ICB therapy in the CLR-high and CLR-low groups. (A) Comparison of the expression levels of key immune checkpoint molecules between the CLR-high group (G1) and the CLR-low group (G2) of HCC patients. (B) Prediction of the response to ICB therapy in the CLR-high (G1) and CLR-low (G2) groups of HCC patients. **p < 0.01, ***p < 0.001, ****p < 0.0001.
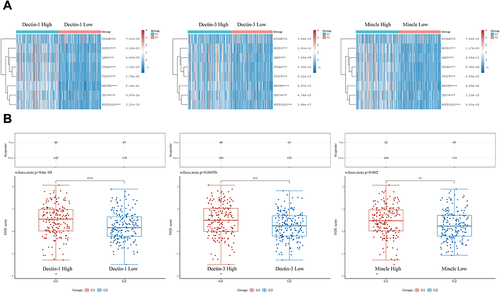
Table 1 Correlations of CLR Family Gene Expression and the Expression of Key Cytokines Regulating Immune Checkpoint Proteins in Hepatocellular Carcinoma
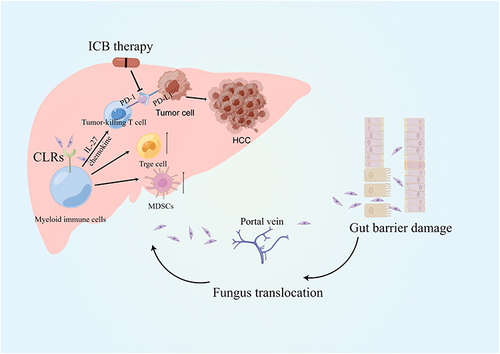
Figure 5 Graphical hypothesis of our study generated by FigDraw.