
Figures & data
Figure 1 Flow chart for selection of study patients.
Abbreviations: ICH, intracerebral hemorrhage; mRS, modified Rankin Scale; IVH, intraventricular hemorrhage.
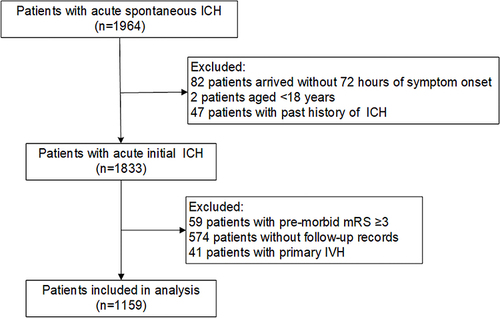
Table 1 Clinical Characteristics Between SIRS and No SIRS Group
Table 2 Effects of SIRS on Death and Major Disability
Figure 2 Subgroup analysis to evaluate the relationship of SIRS on admission and death in cerebral hemorrhage patients of different age (< 60 years or ≥ 60 years), gender, and baseline hematoma volume (<10 mL, 10–30 mL, or >30 mL). (A–C) Show the relationship at 1-month, 3-month and 1-year follow-ups.
Notes: aAdjustment for sex, alcohol use, systolic blood pressure, diastolic blood pressure, Glasgow Coma Scale, National Institutes of Health Stroke Scale, in-hospital infection, surgery, lobar hemorrhage, intraventricular extension, subarachnoid extension, and baseline hematoma volume; bAdjustment for age, alcohol use, systolic blood pressure, diastolic blood pressure, Glasgow Coma Scale, National Institutes of Health Stroke Scale, in-hospital infection, surgery, lobar hemorrhage, intraventricular extension, subarachnoid extension, and baseline hematoma volume; cAdjustment for age, sex, alcohol use, systolic blood pressure, diastolic blood pressure, Glasgow Coma Scale, National Institutes of Health Stroke Scale, in-hospital infection, surgery, lobar hemorrhage, intraventricular extension, and subarachnoid extension.
Abbreviations: SIRS, systemic inflammatory response syndrome; HR, hazard ratio; CI, confidence interval.
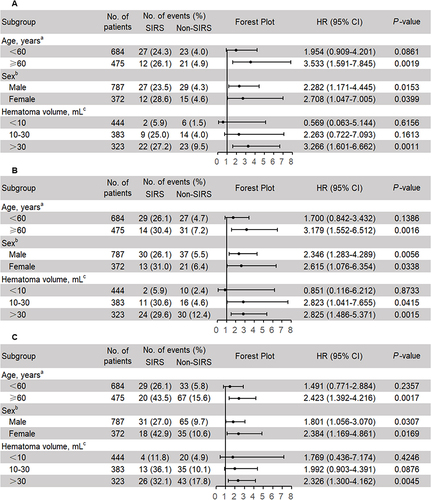
Table 3 Effects of SIRS and In-Hospital Infection on Poor Clinical Outcomes After Cerebral Hemorrhage