Figures & data
Table 1 Cohort Characteristics, Inclusion and Exclusion Criteria
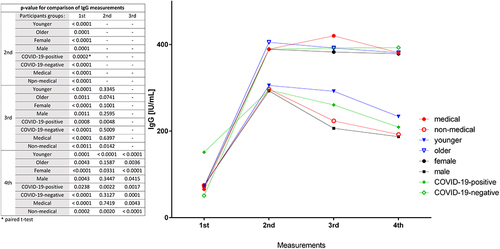
Figure 1 Comparison of anti-SARS-CoV-2 IgG levels [IU/mL] among the examined participants.
![Figure 1 Comparison of anti-SARS-CoV-2 IgG levels [IU/mL] among the examined participants.](/cms/asset/cef1421f-e7af-4ce0-9193-6e344a262052/djir_a_12154764_f0001_c.jpg)
Figure 2 Comparison of relative increase of anti-SARS-CoV-2 IgG levels.
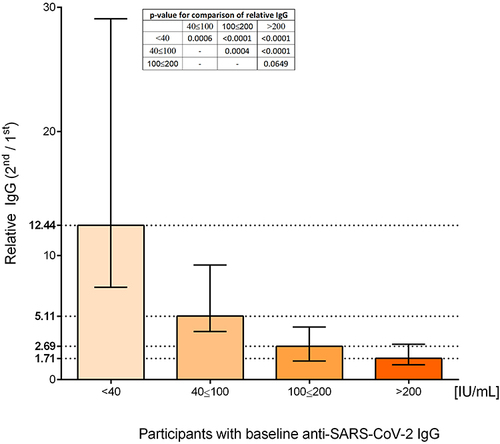
Table 2 Comparison of the Medians (with Quartiles Q1, Q3) of the Anti-SARS-CoV-2 Spike IgG Antibodies Values [IU/mL] Among the Studied Participants (n = 93) Based on Specific Parameters (Age, Sex, COVID-19 History, Profession)
Table 3 Number (%) of Participants Grouped According to Particular Parameters (Age, Sex, COVID-19 History, Profession) Showing Specific Patterns of Trajectory of IgG Antibody Dynamics Between Consecutive Measurements
Figure 3 Dynamics of anti-SARS-CoV-2 IgG of the participants according to age, sex, COVID-19 history and profession.