Figures & data
Table 1 Baseline Clinicopathological Characteristics of the Patients
Figure 1 SIRS is associated with OS in patients with hepatocellular carcinoma. (A and B). Results of the univariate Cox regression analysis and multivariate Cox regression analysis between hematological markers of inflammation and overall survival in the training cohort. (C). The computational formula of SIRS. (D). Kaplan–Meier curves for the overall survival of patients in the high- and low-SIRS groups in the training cohort. (E). Kaplan–Meier curves for the overall survival of patients in the high- and low-SIRS groups in the validation cohort.
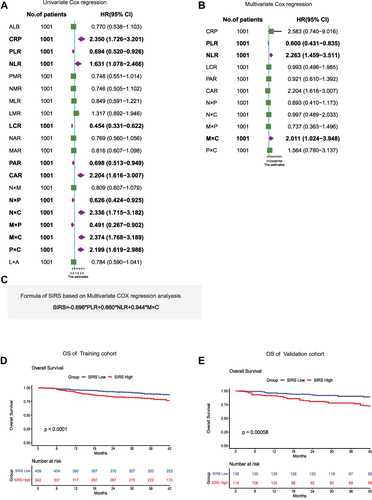
Table 2 Results of the Univariate Cox Regression Analysis and Multivariate Cox Regression Analysis for OS Among the Clinical Characteristics and SIRS
Table 3 Relationship Between SIRS and Clinical Characteristics
Figure 2 Nomogram predicting the overall survival for patients with hepatocellular carcinoma. (A). Nomogram for predicting OS of hepatocellular carcinoma patients after surgery. (B and C). Calibration plot of the nomogram for 1-year survival in the training cohort and validation cohort. (D and E). Calibration plot of the nomogram for 3-year survival in the training cohort and validation cohort. Calibration plot of the nomogram for 5-year survival in the training cohort and validation cohort. (F and G).
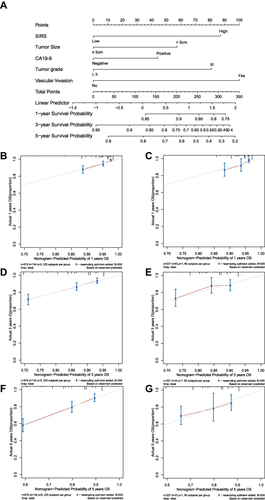
Figure 3 The predictive performance of the nomogram is better than that of traditional prognostic factors. (A). AUC of time-dependent ROC curves verified the prognostic accuracy of the nomogram in the training cohort. (B). AUC of time-dependent ROC curves verified the prognostic accuracy of the nomogram in the validation cohort. (C and D). AUC of ROC curves compared the prognostic accuracy for 1-year survival of the nomogram and traditional prognostic factors in the training cohort and validation cohort. (E and F). AUC of ROC curves compared the prognostic accuracy for 3-year survival of the nomogram and traditional prognostic factors in the training cohort and validation cohort. (G and H). AUC of ROC curves compared the prognostic accuracy for 5-year survival of the nomogram and traditional prognostic factors in the training cohort and validation cohort.
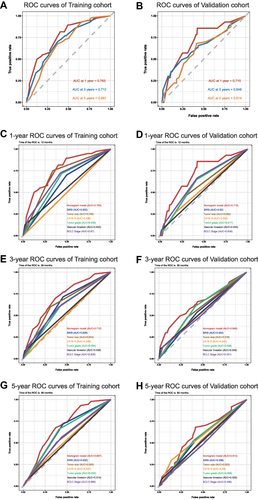
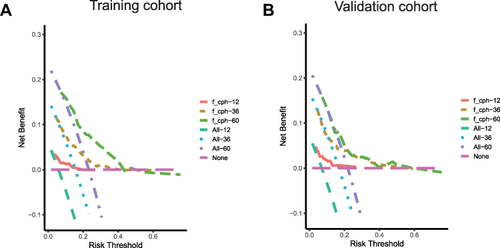
Figure 4 Decision-curve analysis (DCA) plot depicting the standardized net benefit. (A). Training cohort at 12, 36, and 60 months. (B). Validation cohort at 12, 36, and 60 months.