Figures & data
Figure 1 TREM1 expression profiles in normal tissues and tumors. (A) Expression level of TREM1 between tumor and normal tissues in pan-cancer according to the integrated data from GTEx and TCGA datasets. (B) mRNA expression of TREM1 in KIRC, BLCA and BRCA patients assessed by qRT-PCR analysis. (C) Protein expression of TREM1 detected by Western blot in paired KIRC and adjacent normal tissues. (D) Western blot protein detection of theTREM1 expression levels in paired normal tissues and BLCA (left panel), BRCA (right panel) tissues. (E) IHC of TREM1 in paired KIRC and adjacent normal tissues.
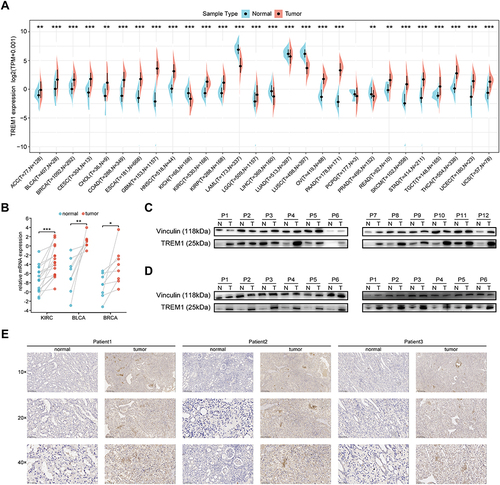
Figure 2 Prognostic value of TREM1 in TCGA pan-cancer. K-M curves of overall survival stratified by the low- and high-expression of TREM1 in indicated cancers. Log rank test was applied to calculate the P values.
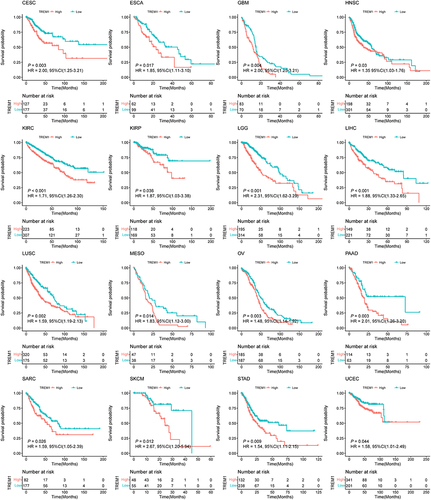
Figure 3 Mutation landscape of TREM1 in pan-cancer. (A and B) Mutation frequency (A) and general mutation count (B) of TREM1 in multiple TCGA pan-cancer studies according to the cBioPortal database. (C) Mutation diagram of TREM1 across protein domains in various cancers. (D) Correlations between TREM1 expression and DNA methylation in pan-cancer. (E–G) Correlations between TREM1 expression and TMB (E), MSI (F), and NEO (G) in pan-cancer.
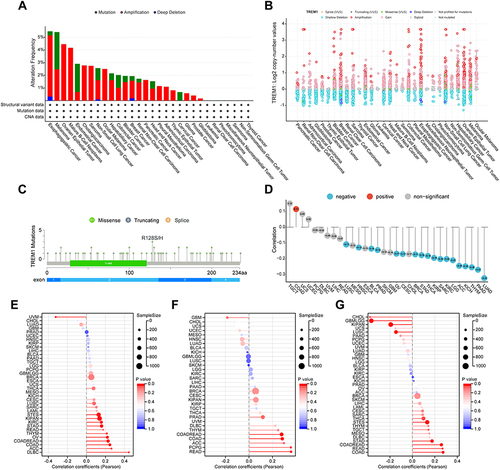
Figure 4 Correlations between TREM1 expression and immune cell infiltration abundance in cancers. (A) Heatmap displaying the correlations between TREM1 expression and infiltration levels of 22 immune cells calculated by CIBERSORT in pan-cancer. (B) Heatmap displaying the correlations between TREM1 expression and estimate scores in pan-cancer. *P < 0.05, **P < 0.01, ***P < 0.001. Abbreviation list of tumor cohorts from TCGA is given in Table S1.
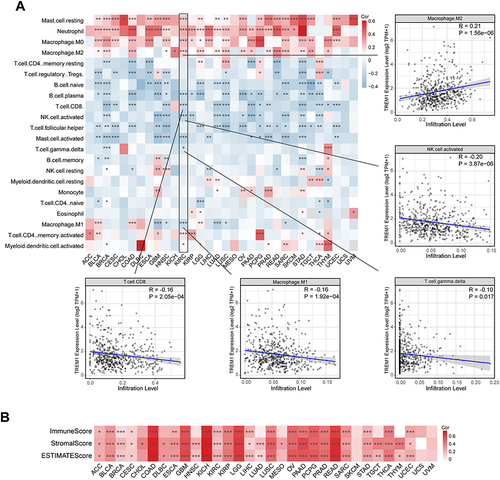
Figure 5 Exploration of the relationship between TREM1 and immune components based on ssGSEA algorithm. (A) Butterfly plot displaying the correlation between TREM1 and TME-related signatures (left panel), KEGG terms, and GO terms (right panel) in KIRC. (B and C) Correlations between TREM1 expression and ssGSEA scores of hallmark (B) or TME (C) gene sets in TCGA pan-cancer.
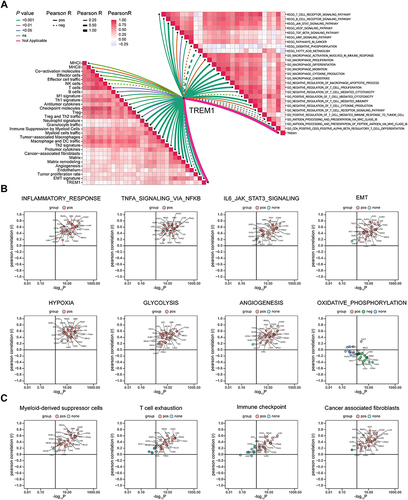
Figure 6 Predictive value of TREM1 in immunotherapy efficacy. (A and B) Kaplan–Meier survival curve of PFS between high- and low-TREM1 subgroups in the IMmotion150 cohort (A) and the IMmotion151 cohort (B). (C and D) Kaplan–Meier survival curve of OS between high- and low-TREM1 subgroups in the CheckMate cohort (C) and the IMvigor210 cohort (D). Log rank test was applied to calculate the P values. (E) Bar charts representing the proportion of patients in high- and low-TREM1 subgroups that responded to immunotherapy in the IMmotion150 cohort. (F) Bar charts representing the proportion of patients in high- and low-TREM1 subgroups that responded to immunotherapy in the IMvigor210 cohort.
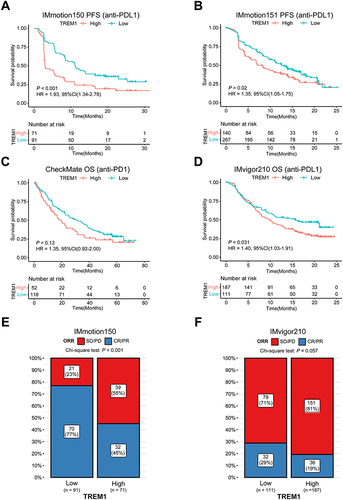
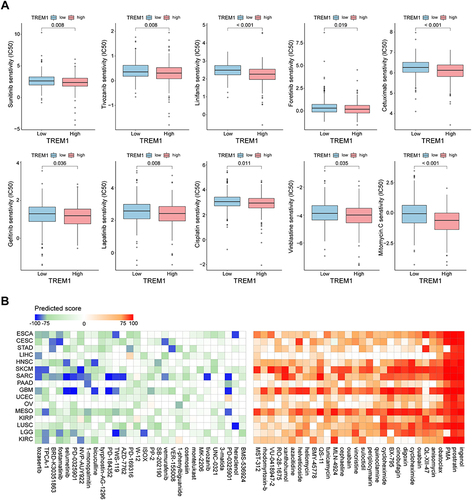
Figure 7 Therapeutic response prediction based on pRRopheticPredict and Connectivity Map analysis. (A) Boxplot displaying difference of the sensitivities to the chemotherapy drugs between patients with a high expression of TREM1 and a low expression of TREM1 in KIRC. (B) Heatmap showing predicted score (positive in red, negative in blue) of top 60 compounds (30 negatively correlated and 30 positively correlated) from the Connectivity Map for indicated cancer type. KIRC, Kidney renal clear cell carcinoma. Abbreviation list of tumor cohorts from TCGA is given in Table S1.