Figures & data
Table 1 Baseline Characteristics of Participants by the Degree of Overall WMH
Table 2 Fazekas Scores Among Patients According to Quartiles of YKL-40
Table 3 Characteristics of Participants the Degree of PV-WMH and D-WMH
Table 4 Logistic Regression Analyses of YKL-40 with White Matter Hyperintensity
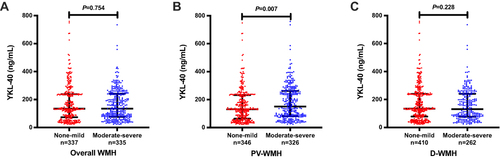
Figure 1 Serum YKL-40 levels in different groups according to (A) overall WMH, (B) PV-WMH and (C) D-WMH in AIS patients. Horizontal lines represent medians (IQR).
Abbreviations: WMH, white matter hyperintensity; PV-WMH, periventricular white matter hyperintensity; D-WMH, deep white matter hyperintensity.