Figures & data
Figure 1 Exploration of CC chemokines family in lung cancer.
Notes: (A) TCGA-LUAD; (B) TIDE analysis was performed to evaluate the immunotherapy response; (C) CC chemokines family was extracted; (D) Correlation analysis of CC chemokines family and TIDE score, *P < 0.05, **P < 0.01; (E) The expression level of CC chemokines family in immunotherapy responders and non-responders, ns = P > 0.05, *P < 0.05, **P < 0.01, ***P <0.001.
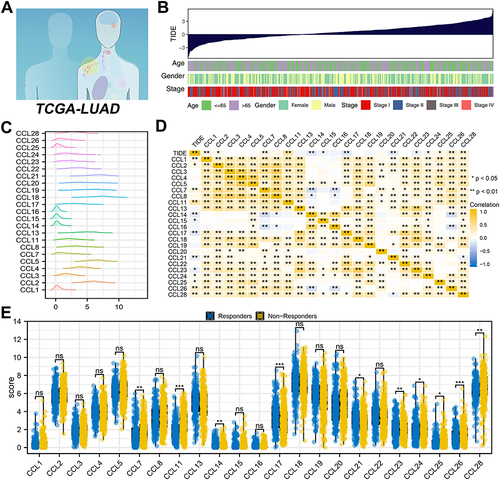
Figure 2 Treg affects immunotherapy of lung cancer.
Notes: (A) ssGSEA algorithm was performed to quantify the immune microenvironment of lung cancer patients; (B) Correlation between TIDE score and immune terms, *P < 0.05, **P < 0.01; (C) The level of immune terms between immunotherapy responders and non-responders, ns = P > 0.05, *P < 0.05, **P < 0.01, ***P <0.001.; (D) TIDE was positively correlated with Treg; (E) Immunotherapy non-responders had a higher Treg, *P < 0.05; (F) The percentage of immunotherapy responders and non-responders in patients with high and low Treg infiltration.
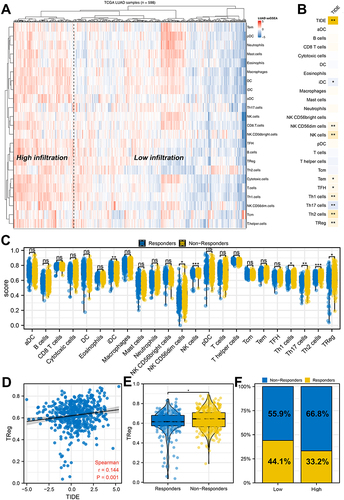
Figure 3 Biological exploration of Treg.
Notes: (A) Overview of the Treg in TCGA-LUAD patients; (B) DEGs analysis between patients with high and low Treg infiltration; (C) GSEA analysis of the Treg; (D) GO analysis of the Treg; (E–H) Correlation between Treg and immune checkpoint inhibitors.
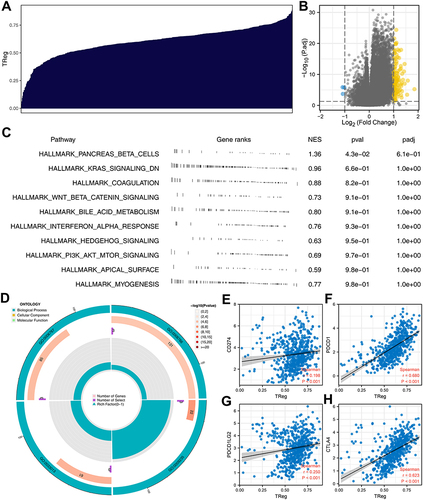
Figure 4 Further exploration of CCL7, CCL11, CCL26 and CCL28.
Notes: (A) Correlation between Treg and CC chemokines family, *P < 0.05, **P < 0.01; (B–E) Correlation between Treg and CCL7, CCL11, CCL26 and CCL28; (F) The effect of CCL7 on lung cancer immunotherapy; (G) The effect of CCL11 on lung cancer immunotherapy; (H) The effect of CCL26 on lung cancer immunotherapy; (I) The effect of CCL28 on lung cancer immunotherapy.
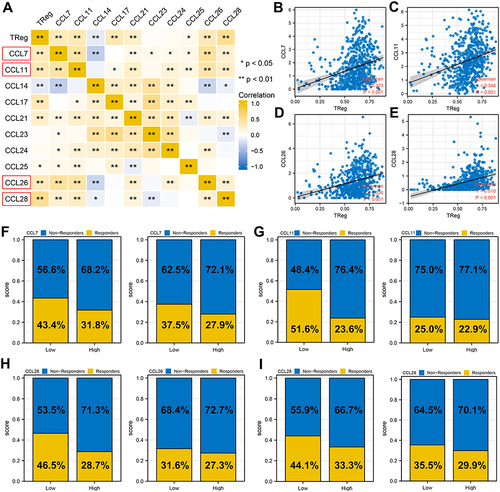
Figure 5 Hypoxia was associated with the Treg infiltration and CCL7, CCL11, CCL26, CCL28.
Notes: (A) GSVA analysis in patients with high and low Treg infiltration; (B) The quantified hypoxia activity of TCGA-LUAD patients; (C) The CCL7, CCL11, CCL26 and CCL28 expression in patients with high and low Treg infiltration, ns=P>0.05, ***P<0.001; (D) Correlation between Treg and hypoxia; (E–H) Correlation between HIF-1α and CCL7, CCL11, CCL26 and CCL28; (I) GSEA analysis of CCL7; (J) GSEA analysis of CCL11; (K) GSEA analysis of CCL26; (L) GSEA analysis of CCL28.
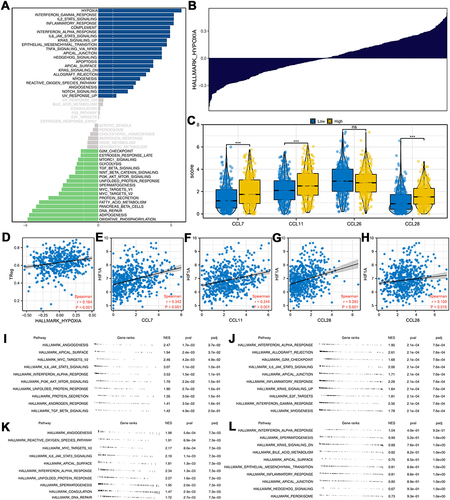
Figure 6 Clinical correlation of CCL7, CCL11, CCL26, CCL28.
Notes: (A) Univariate Cox regression analysis (overall survival) of CCL7, CCL11, CCL26, CCL28; (B) Univariate Cox regression analysis (disease-free survival) of CCL7, CCL11, CCL26, CCL28; (C) Univariate Cox regression analysis (progression-free survival) of CCL7, CCL11, CCL26, CCL28; (D–I) Expression level of CCL7, CCL11, CCL26, CCL28 in patients with different clinical features, ns = P > 0.05, *P < 0.05, **P < 0.01.; (J–M) Correlation between TIDE and Treg, CCL7, CCL11, CCL26, CCL28, *P < 0.05, **P < 0.01.
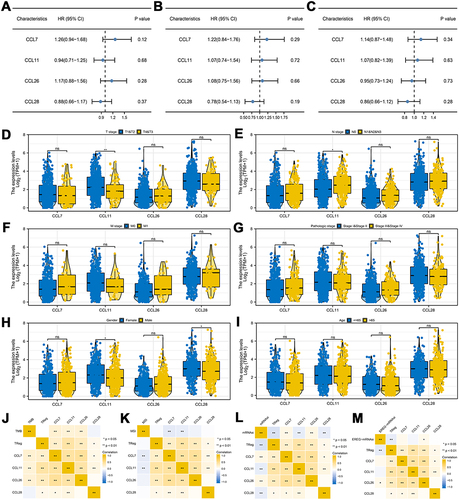
Figure 7 Hypoxia induces HIF-1α and CCL28 elevation.
Notes: (A) Hypothesis plot; (B) The morphology of H1299 and A549 cells was observed under the light microscope; (C and D) The level of CCL14, CCL24, CCL7, CCL11, CCL25, CCL17, CCL23, CCL26 and CCL28 in control and hypoxia cells, ns = P < 0.05, ****P < 0.0001; (E) The level of HIF-1α in control and hypoxia cells, *P < 0.05, **P < 0.01; (F) The level of CCL28 in control and hypoxia cells, ***P < 0.001, ****P < 0.0001; (G–I) The protein level of HIF-1α and CCL28 in control and hypoxia cells, **P < 0.01, ***P < 0.001.
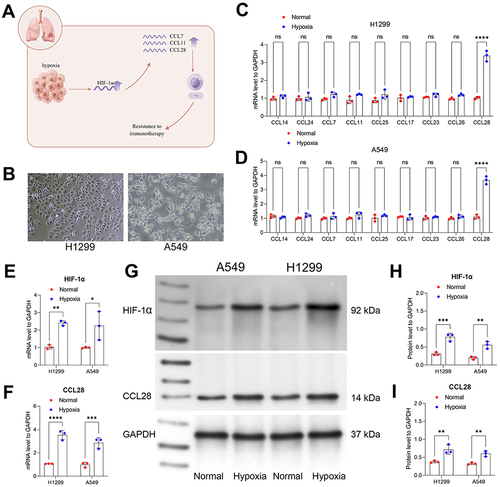
Figure 8 HIF-1α can regulate the CCL28 expression.
Notes: (A) Knockdown of HIF-1α can significantly decrease the protein level of CCL28; (B) ELISA was used to detect CCL28 secretion of lung gland cells before and after interference, ***P < 0.001; (C) Cloning and sequencing identification of CCL28 promoter fragment and its mutants; (D) Wild-type CCL28-luciferase but not mutant CCL28-luciferase were able to respond to HIF-1α, ***P < 0.001; (E) ChIP assay showed that HIF-1α can bind to the promotor of CCL28.
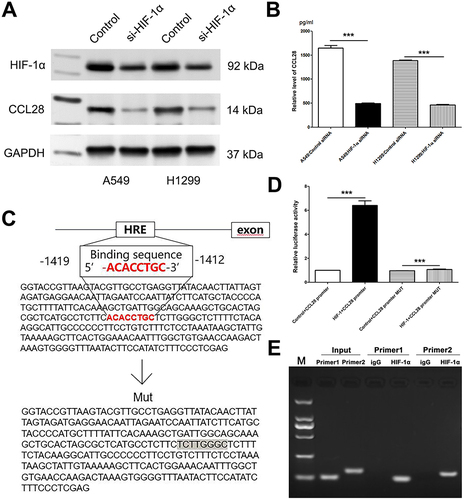
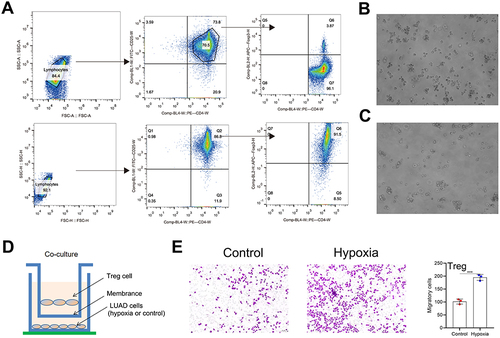
Figure 9 Isolation and identification of Treg cells.
Notes: (A) FCS identifies the proportion of CD4+CD25+Foxp3+ Treg cells and purified CD4+CD25+Foxp3+ Treg cells in peripheral blood; (B and C) Treg cell morphology under the light microscope; (D) Co-cultured system; (E) Tregs co-cultured with hypoxia A549 cells had more access to the lower chamber, ***P < 0.001.