Figures & data
Figure 1 Measurement of salivary inflammatory and anti-inflammatory profile by multiplex ELISA. Created with BioRender.com.
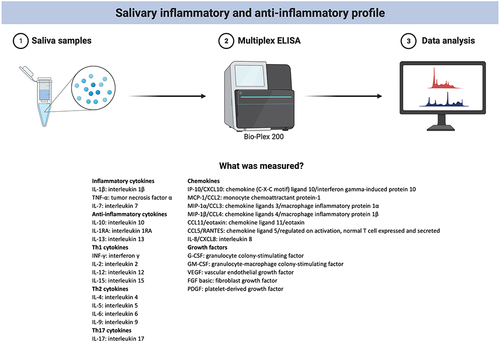
Table 1 Clinical Data of Children with Chronic Kidney Disease (CKD) Compared to Healthy Children (C)
Figure 2 Concentration of salivary pro-inflammatory and anti-inflammatory cytokines as well as Th1, Th2 and Th17 in the saliva of children with chronic kidney disease (CKD) compared to healthy children (C).
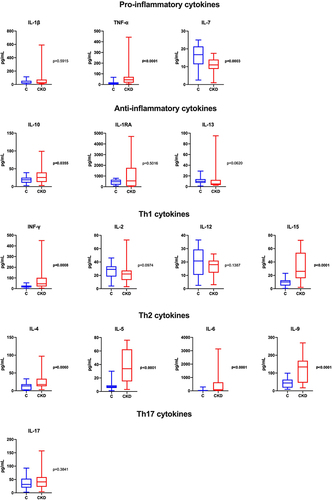
Figure 3 Concentration of salivary chemokines and growth factors in the saliva of children with chronic kidney disease (CKD) compared to healthy children (C).
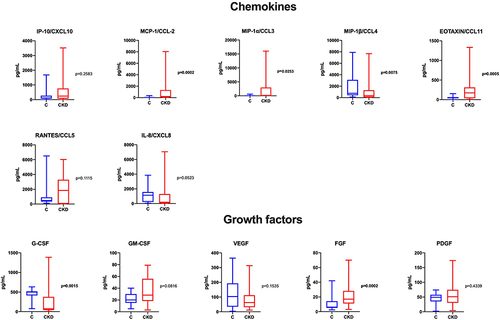
Table 2 Multivariate Linear Regression Analysis Between the Secretory Function of the Salivary Glands and Salivary Inflammatory and Anti-Inflammatory Profile in Children with CKD and the Control
Table 3 Multivariate Linear Regression Analysis Between Renal Function and Salivary Inflammatory and Anti-Inflammatory Profile in Children with CKD and the Control
Figure 4 Analysis of the diagnostic utility of salivary MIP-1α/CCL3 in differentiating children with CKD and normal saliva secretion (NS) from patients with hyposalivation (HS).
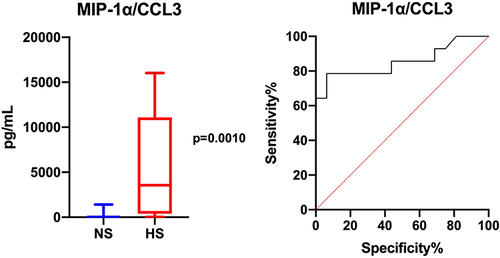
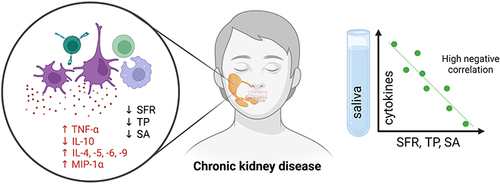
Figure 5 Graphical conclusions from the study. Created with BioRender.com.