Figures & data
Table 1 Baseline Characteristics
Figure 1 Baseline characteristics of abdominal infection in patients after laparotomy. There were no sex-based differences between the three groups (a), but patients with abdominal sepsis were older than those in the only infection group (b). The APACHE II score was higher in the sepsis and septic shock groups, especially the septic shock group. The SOFA score was only higher between the non-sepsis group and the sepsis or septic group (c). The causes of abdominal infection are shown in (d). Positive blood microbiological data are shown, but no significant differences in microorganism cultures were observed between the sepsis group and the septic shock group (e). No differences were found in patients with and without organ dysfunction between these two groups (f). *p<0.005 abdominal-infectious control vs sepsis groups. **p<0.005 sepsis group vs abdominal septic shock group.
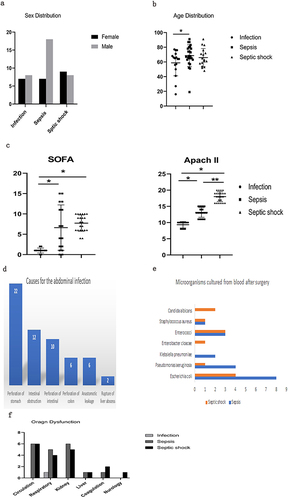
Table 2 Primary and Secondary End Points
Figure 2 Outcomes and serious adverse events of abdominal infection after laparotomy. Mortality was significantly higher in the septic shock group compared to the other two groups (a). There were more vasopressors administered in the sepsis or septic group compared to the non-sepsis group (b). Adverse events are listed; No significant differences were observed across the three groups (c). *p<0.005 abdominal-infectious control vs sepsis groups. **p<0.005 sepsis group vs abdominal septic shock group.
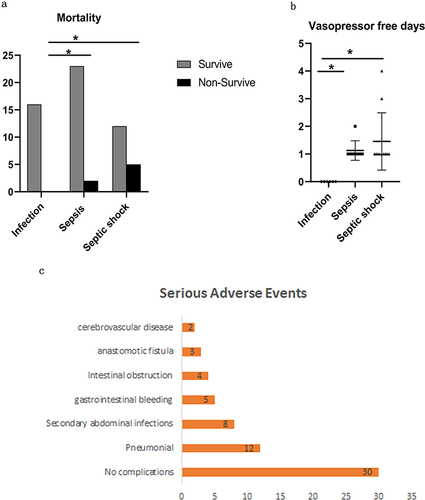
Table 3 Levels of 14 Biomarkers in the Abdominal Cavity of Enrolled Patients
Figure 3 Comparative analysis of peritoneal biomarker levels in the different groups. IL-1β, IL-17, IL-2, TNF-α, IL-8, IL-6, MCP-1, IP-10, IL-8, and TGF-β were higher in the sepsis groups compared to the non-sepsis group. Except for IL-8 and TGF-β, these cytokines of the septic shock group were also higher than those of the sepsis group. *p< 0.005 abdominal-infectious control vs abdominal sepsis group. **p< 0.005 sepsis group vs abdominal septic shock group.
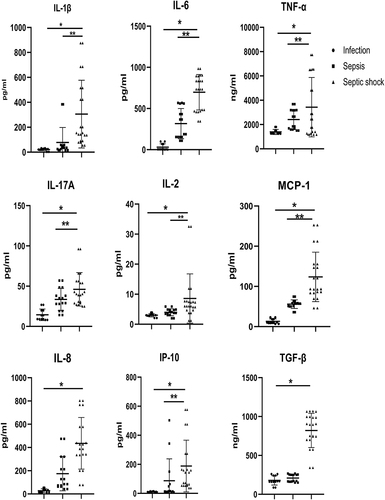
Table 4 Correlation Between Peritoneal Cytokines and Severity of Illness Parameters
Figure 4 Positive correlation between peritoneal biomarkers and predictive risk of severity of sepsis. Peritoneal concentrations of IL-1β, IL-2, TNF-α, IL-8, IL-6, MCP-1, and IL-17 showed positive correlations with APACHE II scores. The correlation coefficients ranged from 0.417 to 0.833.
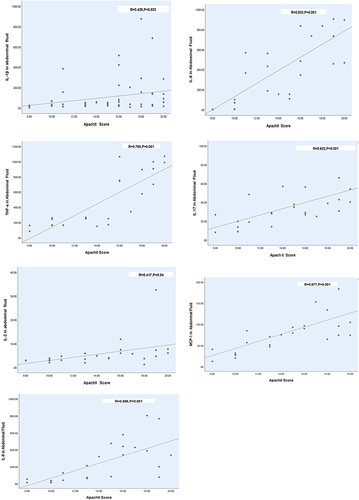
Table 5 Levels of 14 Biomarkers in the Serum of Enrolled Patients
Table 6 Correlation Between Serum Cytokines and Severity of Illness Parameters
Figure 5 Comparative analysis of serum biomarker levels in the different groups. Serum levels of IL-10, IL-12, MCP-1, IL-6, IL-8, and TGF-β were increased significantly in septic shock, especially for levels of IL-10, IL-12, and MCP-1 that showed statistical differences between the three groups. *p <0.005 abdominal infectious control vs abdominal sepsis group. **p<0.005 sepsis group vs abdominal septic shock group.
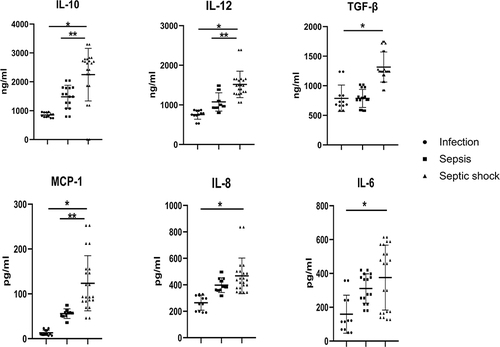
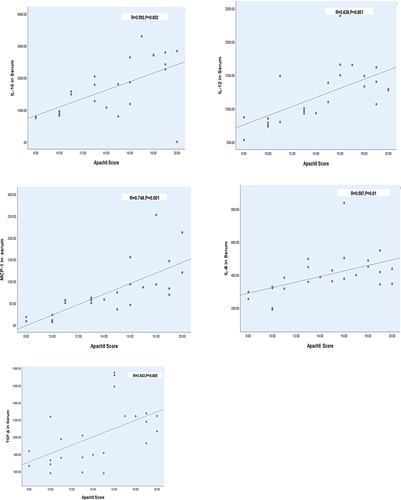
Figure 6 Positive correlation between serum biomarkers and predictive risk of severity of sepsis (APACHE II scores). Serum concentrations of IL-10, IL-12, MCP-1, IL-8, and TGF-β showed positive correlations with APACHE II scores. The correlation coefficients ranged from 0.384 to 0.748.