Figures & data
Table 1 Patient Baseline Characteristics and Correlations with HSP90α (n=228)
Table 2 Comparative Univariate Survival Analyses of 228 Patients with LUAD
Table 3 Comparative Multivariate Survival Analyses of 228 Patients with LUAD
Figure 1 K-M curves for PFS and OS of HSP90α in 228 LUAD patients. (A) K-M curve for PFS in high and low level HSP90α patients with LUAD; (B) K-M curve for OS in high and low level HSP90α patients with LUAD.
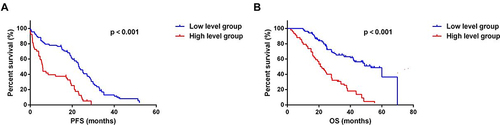
Figure 2 Relationship between HSP90α and TNM stage in 228 LUAD patients.
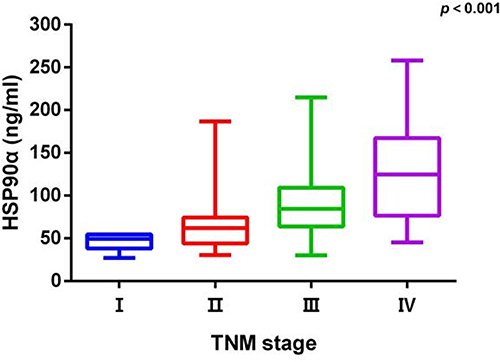
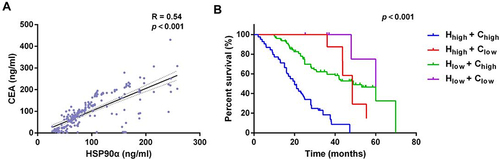
Figure 3 Correlation of HSP90α1 with CEA and prognosis of HSP90α combined with CEA in 228 LUAD patients. (A) Correlation analysis between the expression levels of HSP90α and CEA in in the serum of patients with LUAD; (B) The K–M curve and Log rank test for OS in different level HSP90α patients with LUAD.