
Figures & data
Figure 1 The flow chart of patient selection process.
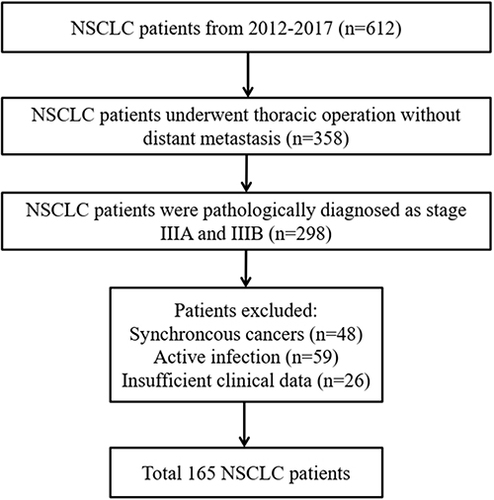
Table 1 Association of the NPS with LA-NSCLC Patient Clinicopathological Characteristics
Figure 2 Kaplan-Meier curves for OS in patients with LA-NSCLC according to Alb (A), TC (B), PNI (C), NLR (D), LMR (E) and SIS (F).
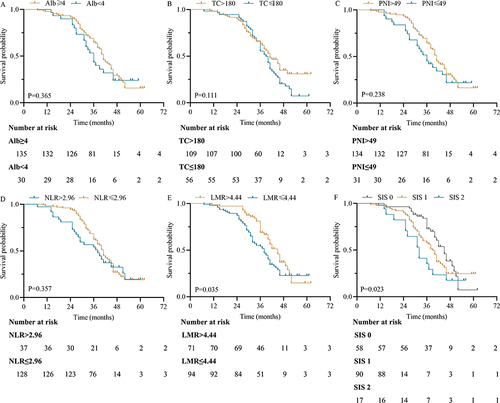
Figure 3 Kaplan-Meier curves for PFS in patients with LA-NSCLC according to Alb (A), TC (B), PNI (C), NLR (D), LMR (E) and SIS (F).
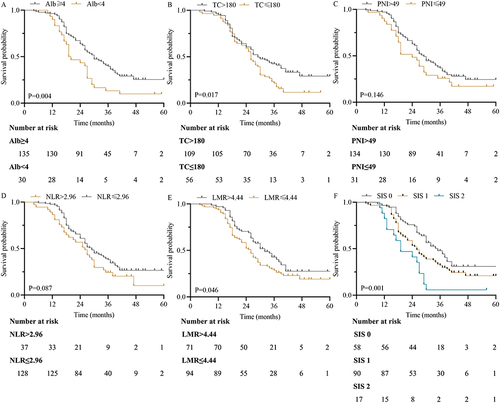
Table 2 ROC Analysis of Inflammatory or Nutritional-Related Indicators
Figure 4 Correlation analysis between Alb and NLR (A), Alb and LMR (B), TC and NLR (C), TC and LMR (D).
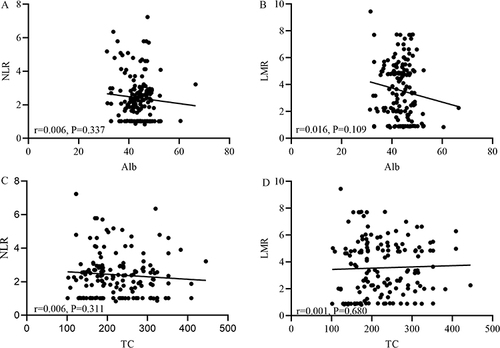
Figure 5 ROC curves of NPS for predicting OS (A) and DFS (B).
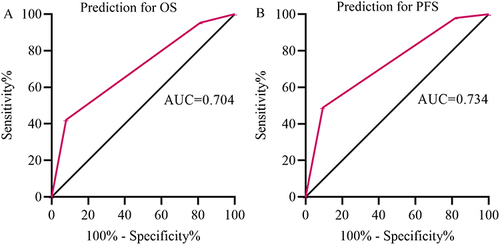
Figure 6 Kaplan-Meier survival curves in patients with LA-NSCLC. (A) OS based on NPS groups; (B) DFS based on NPS groups.
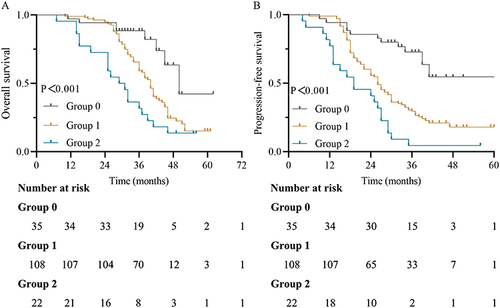
Figure 7 Kaplan-Meier survival curves in patients with LA-NSCLC according to the TNM stage. (A and B) OS and DFS based on NPS groups in stage IIIA; (C and D) OS and DFS based on NPS groups in stage IIIB.
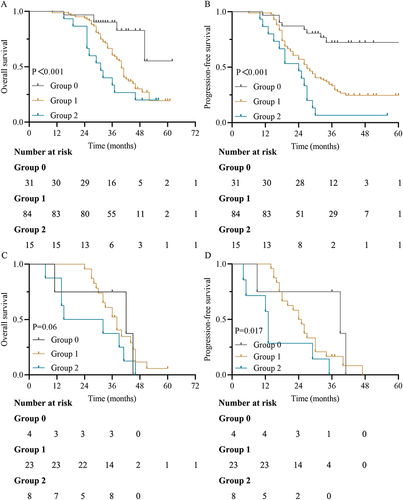
Table 3 Univariate and Multivariate Analyses of OS
Table 4 Univariate and Multivariate Analyses of DFS