Figures & data
Table 1 Characteristics of the Study Population Based on SII Index Quartiles
Table 2 Cox Regression Analysis of SII Index for All-Cause, CVD, and Cancer-Related Mortality in CVD Patients
Table 3 Subgroups Analysis for the Associations of SII Index with All-Cause Mortality in CVD Patients
Table 4 Subgroups Analysis for the Associations of SII Index with CVD Mortality in CVD Patients
Table 5 Subgroups Analysis for the Associations of SII Index with Cancer-Related Mortality in CVD Patients
Figure 1 The RCS curve of the association between SII index and all-cause (A), CVD (B and C) cancer-related mortality in CVD patients.
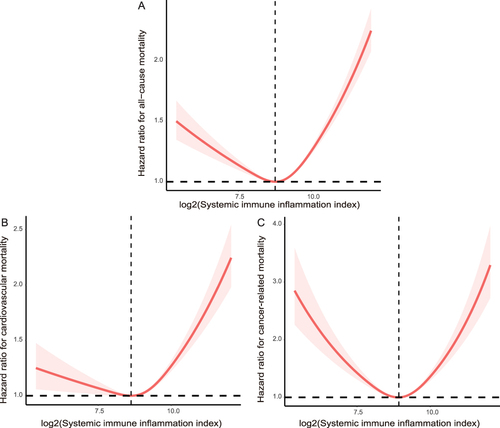
Figure 2 Kaplan-Meier survival curve for all-cause (A), CVD (B and C) cancer-related mortality in CVD patients.
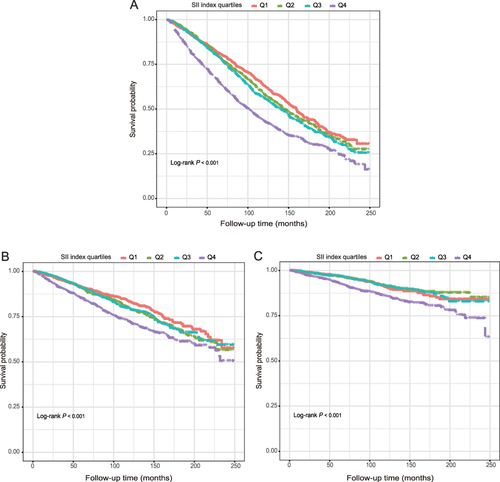
Figure 3 The RCS curve of the association between SII index and all-cause (A), CVD (B and C) cancer-related mortality in CHD patients.
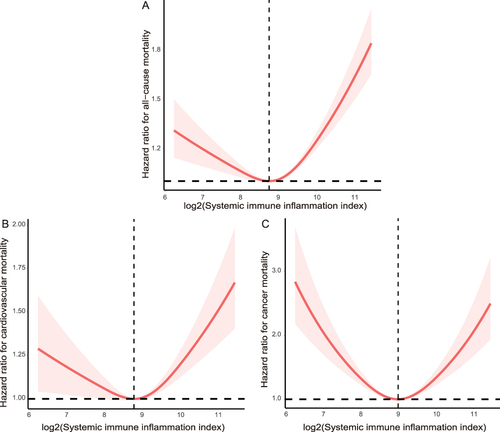
Figure 4 Kaplan-Meier survival curve for all-cause (A), CVD (B and C) cancer-related mortality in CHD patients.
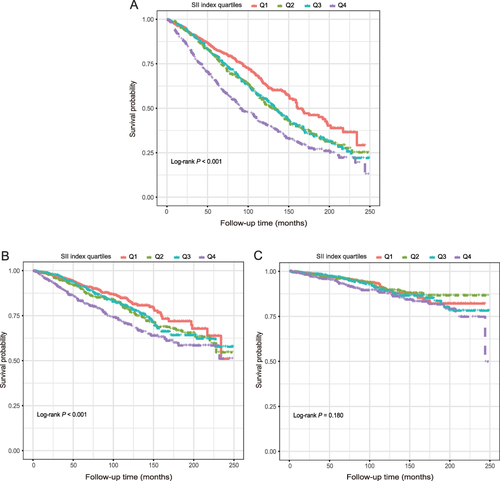
Figure 5 The RCS curve of the association between SII index and all-cause (A), CVD (B and C) cancer-related mortality in CHF patients.
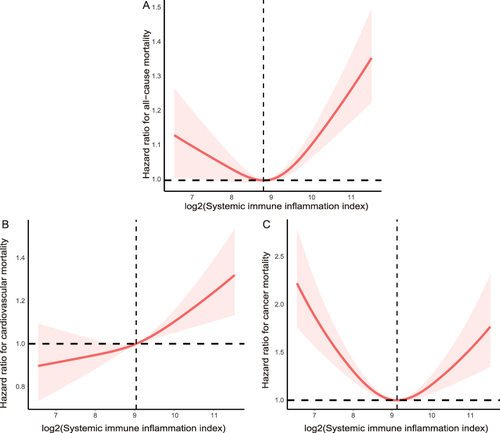
Figure 6 Kaplan-Meier survival curve for all-cause (A), CVD (B and C) cancer-related mortality in CHF patients.
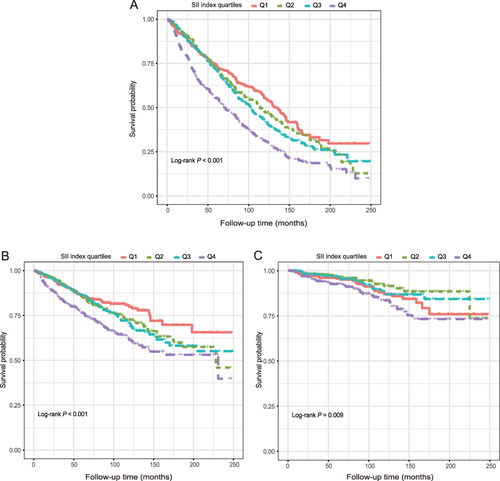
Figure 7 The RCS curve of the association between SII index and all-cause (A), CVD (B and C) cancer-related mortality in angina pectoris patients.
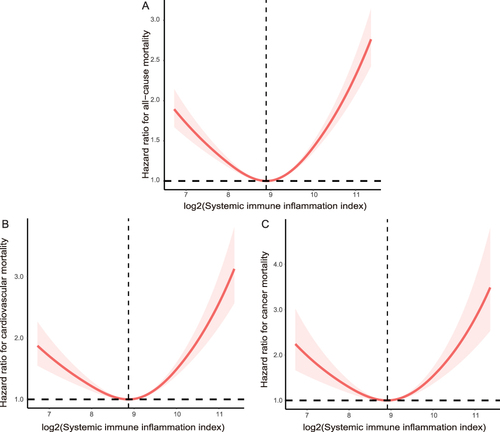
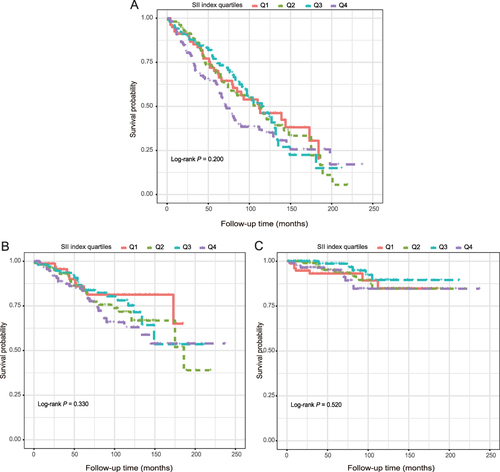
Figure 8 Kaplan-Meier survival curve for all-cause (A), CVD (B and C) cancer-related mortality in angina pectoris patients.
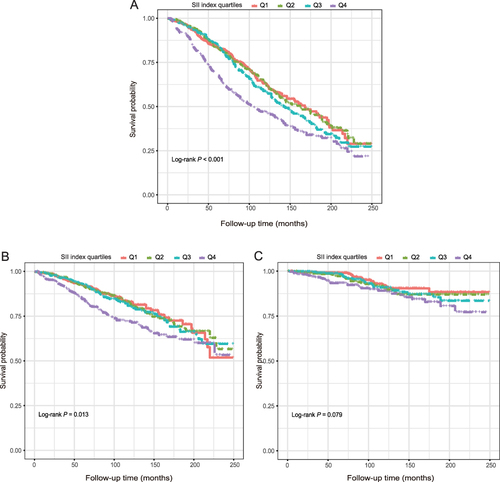
Figure 9 The RCS curve of the association between SII index and all-cause (A), CVD (B and C) cancer-related mortality in MI patients.
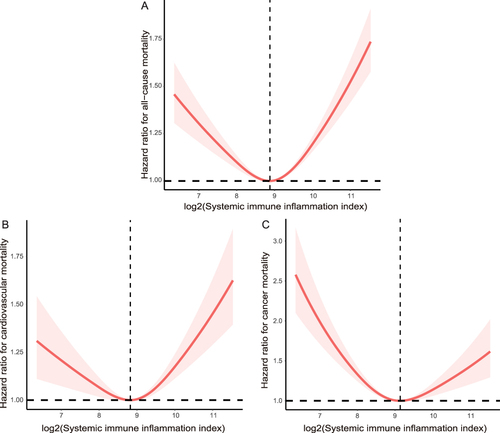
Figure 10 Kaplan-Meier survival curve for all-cause (A), CVD (B and C) cancer-related mortality in MI patients.
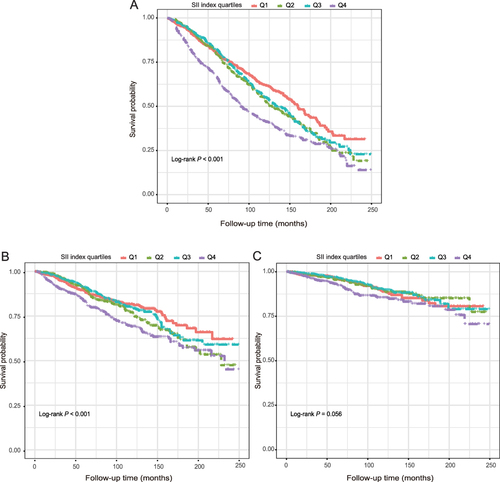
Figure 11 The RCS curve of the association between SII index and all-cause (A), CVD (B and C) cancer-related mortality in stroke patients.
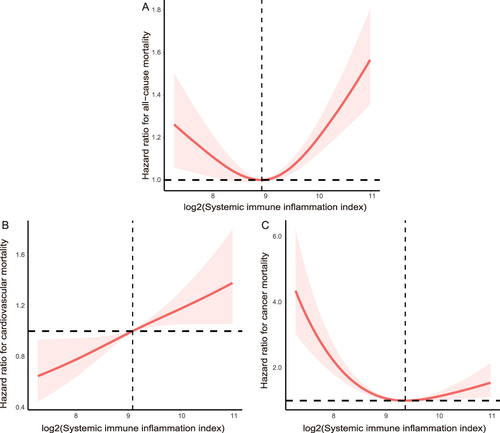
Figure 12 Kaplan-Meier survival curve for all-cause (A), CVD (B and C) cancer-related mortality in stroke patients.