Figures & data
Table 1 A Summary of Microarray Information
Figure 1 Study flow chart for this work.
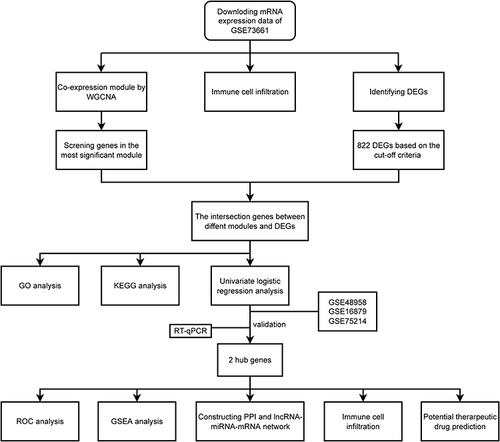
Figure 2 Weighted gene co-expression network analysis (WGCNA) and identification of differential expressed genes (DEGs). (A) Hierarchical clustering of UC genes that are expressed similarly. (B) Module–trait relationships in UC. The relevant P value and correlation coefficient are listed in each cell. (C) DEGs between the control and UC groups are shown on a volcano plot. (D) Venn diagram shows genes identified from the intersection of DEGs and significant module genes in WGCNA.
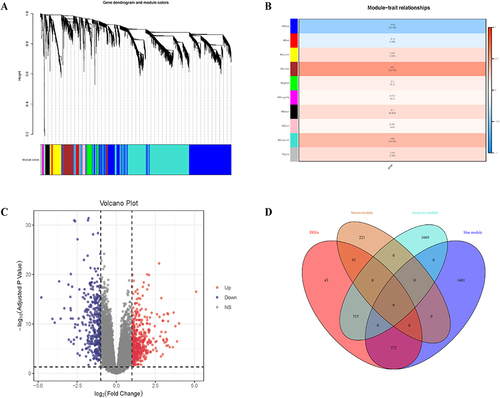
Figure 3 Enriched GO terms in (A) blue module-DEGs, (C) turquoise module-DEGs and (E) brown module-DEGs. Enriched KEGG terms in (B) blue DEGs, (D) turquoise DEGs and (F) brown DEGs. GO, Gene Ontology; BP, biological process; CC, cellular component; MF, molecular function; KEGG, Kyoto Encyclopedia of Genes and Genomes.
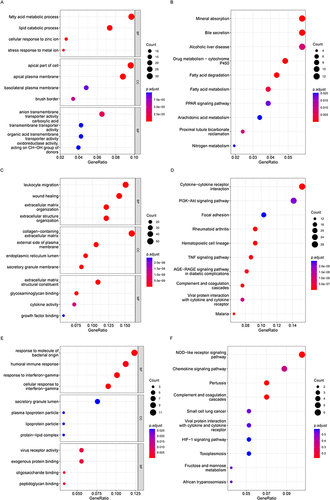
Table 2 The Top 5 DEGs in Univariate Analysis
Figure 4 The identification of hub genes. The expressions of PLPP1 and XBP1 in (A) GSE73661, (B) GSE48958, (C) GSE16879, and (D) GSE75214. (E) qRT-PCR validation of the PLPP1 and XBP1. *** means P < 0.001; **** means P < 0.0001.
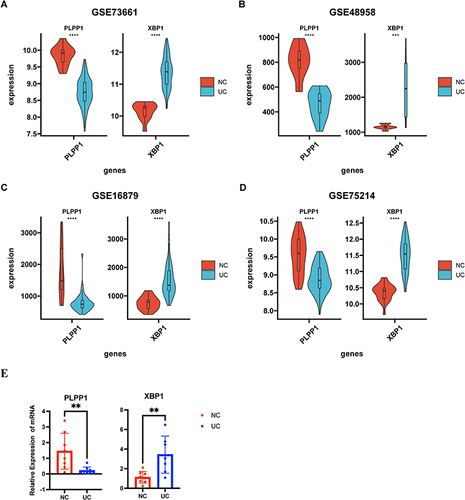
Figure 5 The receiver operating characteristic curve analysis of hub genes in (A) GSE73661, (B) GSE48958, (C) GSE16879, and (D) GSE75214.
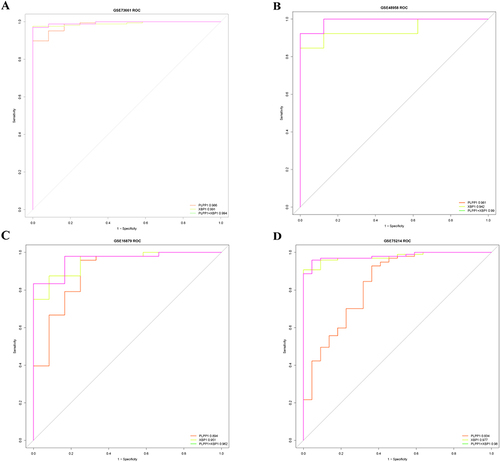
Figure 6 The expression levels of hub genes in different disease degrees were different in (A) GSE73661, (C) GSE11223, and (E) GSE92415. The correlation between XBP1 expression level and clinical scores in (A) GSE73661, (C) GSE11223, and (E) GSE92415. ns, no significance; * means P < 0.05;** means P < 0.01;**** means P < 0.0001.
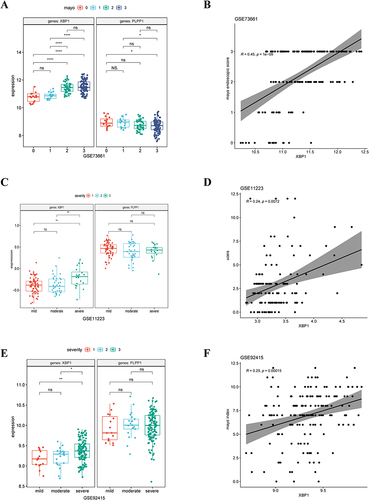
Figure 7 Immune cell infiltration analysis. (A) 22 distinct immune cell subtype compositions in both UC and normal tissue samples. (B) Correlation between XBP1 and PLPP1 with immune infiltrating cells. ns, no significance; * means P < 0.05, ** means P < 0.01; *** means P < 0.001; **** means P < 0.0001.
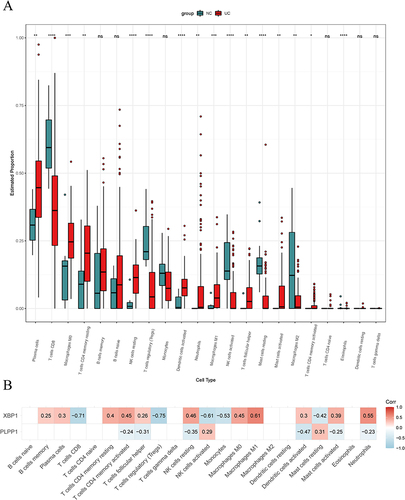
Table 3 Potential Top Drug Compounds for UC
Figure 8 (A) The protein-protein interaction network of XBP1 and PLPfP1.The gene set enrichment analysis for (B) PLPP1 and (C) XBP1.
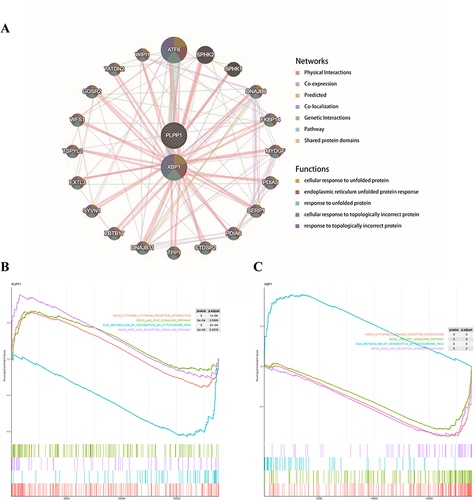
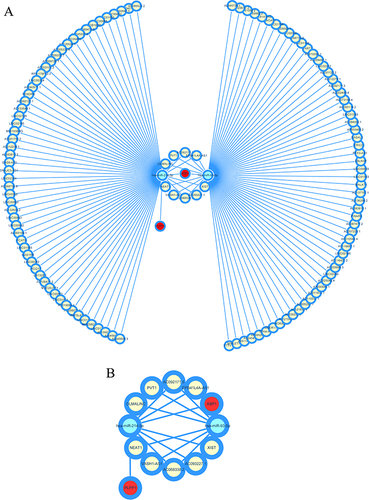
Figure 9 (A) The integrated lncRNA-miRNA-hub genes network and (B) the center of the network. Red circle: hub gene. Yellow circle: lncRNA. Blue circle: miRNA.