Figures & data
Figure 1 Isolation and characterization of dental pulp stem cells (DPSCs). (A) The experimental schedule. (B)The morphology of primary DPSCs. (C)The morphology of the third generation of DPSCs. (D) The identification of DPSCs by flow cytometry with CD73, CD90, CD105, CD34, CD45 and HLA-DR antibodies. (E) Calcium formation was identified by alizarin red staining. (F) Lipid formation was identified by angelic oil red O staining.
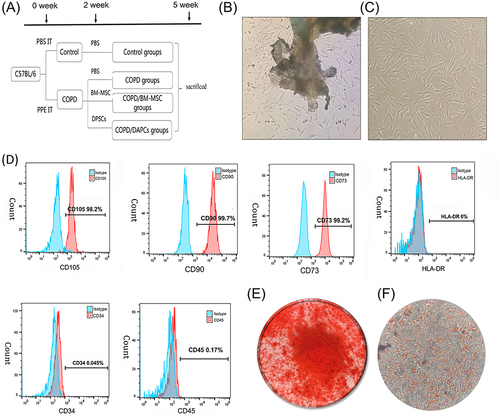
Figure 2 The effect of dental pulp stem cells (DPSCs) on chronic obstructive pulmonary disease (COPD) mice. (A) The weight of mice changed over time. (B) Respiratory dynamic compliance (Cydn), resistance of lung (RL), and ratio of forced expiratory volume in 0.1 s to forced vital capacity (FEV0.1/FVC) were measured by the pulmonary function analysis system. (C) Representative HE staining lung tissue sections 3 weeks after transplantation. The blue arrows represent the pulmonary bulla. Original magnification ×100. (D) The mean linear intercept (MLI) and the proportion of alveolar space for the control, COPD, COPD/BM-MSCs, COPD/DPSCs. (E) Representative Victoria blue staining lung tissue sections 3 weeks after transplantation. The dark arrows represent elastic fiber. Original magnification ×200. (F) Statistical diagram of the proportion of elastic fibers. *p<0.05, **p<0.01, ***p<0.001.
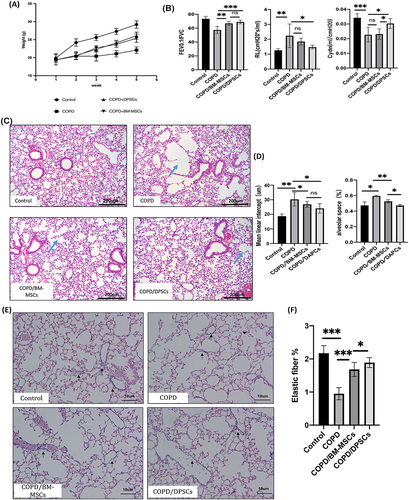
Figure 3 Dental pulp stem cells (DPSCs) reduce the level of inflammation in a mouse COPD model. (A) An ELISA kit was used to measure the levels of IL-1β and TNF-α in BALF (n=4). (B) RT-qPCR was used to measure the mRNA expression of IL-1β, IL6 and TNF-α in lung tissue (n=6). *p<0.05, **p<0.01, ***p<0.001.
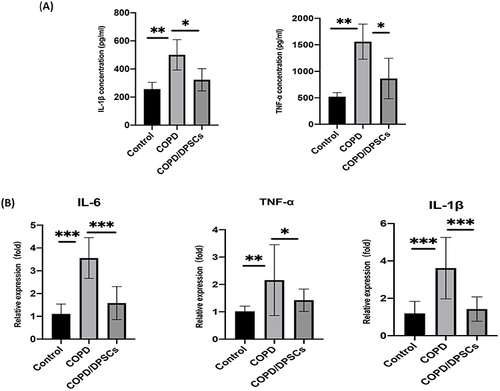
Figure 4 Dental pulp stem cells (DPSCs) inhibited oxidative stress in a mouse COPD model. Levels of malondialdehyde (MDA), catalase (CAT) and glutathione (GSH) as markers of oxidative stress. *p<0.05, **p<0.01, ***p<0.001.
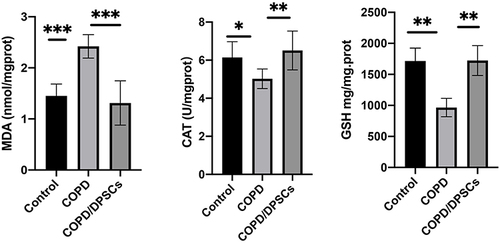
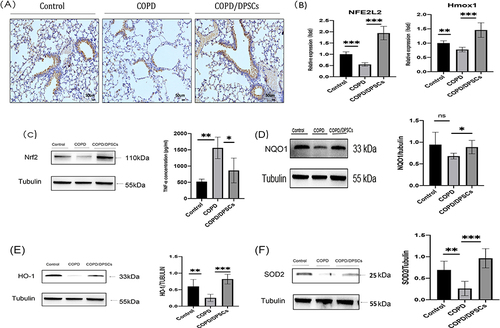
Figure 5 Dental pulp stem cells (DPSCs) transplantation activated Nrf2 and downstream cytokine expression. (A) Immunohistochemical staining of Nrf2; the positive result is brownish yellow, and the nucleus is blue. (B) The effects of DPSCs on the expression of Nrf2 and HO-1 at the RNA level. (C–F) The expression of Nrf2, NQO1, HO-1 and SOD2 at the protein level. *p<0.05, **p<0.01, ***p<0.001.