Figures & data
Table 1 Characteristics of the Study Population Based on sUA Quartiles
Table 2 Adjusted ORs for Associations Between sUA and the Risk of AAC
Table 3 Adjusted ORs for Associations Between sUA and the Incidence of SAAC
Figure 1 RCS curve of the association between sUA and the risk of AAC and SAAC in the NHANES database. (A) the association between sUA and AAC; and (B) the association between sUA and SAAC.
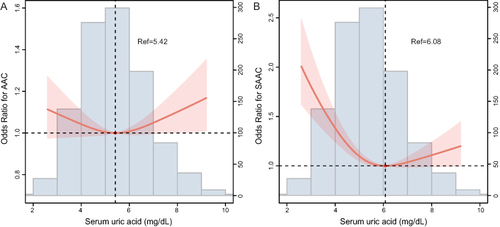
Table 4 Subgroups Analysis for the Associations of sUA with the Risk of AAC
Table 5 Subgroups Analysis for the Associations of sUA with the Risk of SAAC
Figure 2 RCS curve for the association between sUA with the risk of AAC. (A) the association between sUA and AAC stratified by age; (B) the association between sUA and AAC stratified by sex; (C) the association between sUA and AAC stratified by hypertension; (D) the association between sUA and AAC stratified by DM; and (E) the association between SUA and AAC stratified by BMI.
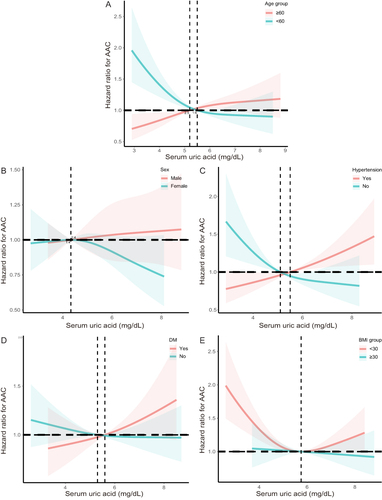
Figure 3 RCS curve for the association between sUA with the risk of SAAC. (A) the association between sUA and SAAC stratified by age; (B) the association between sUA and SAAC stratified by sex; (C) the association between SUA and SAAC stratified by hypertension; (D) the association between SUA and SAAC stratified by DM; and (E) the association between SUA and SAAC stratified by BMI.
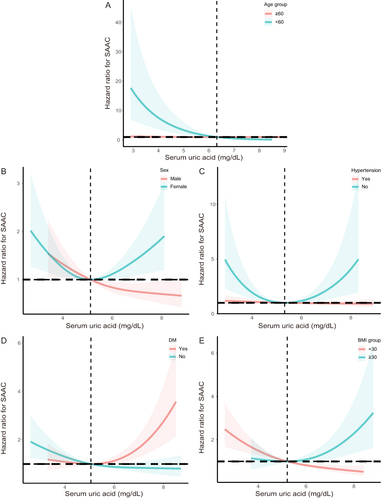
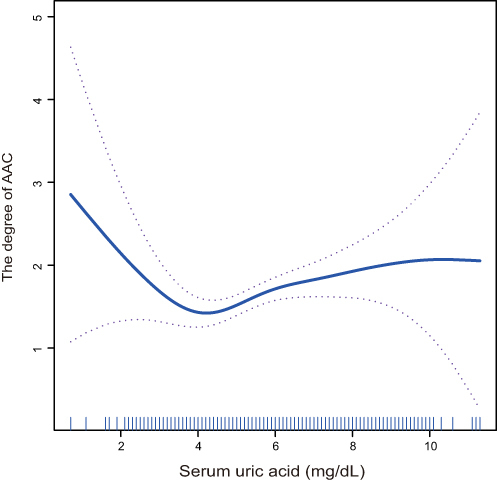
Figure 4 The association between sUA and the degree of AAC.