Figures & data
Table 1 Behavioral Scoring Criteria for Allergic Rhinitis in Mice
Figure 1 H&E staining results of the control group, viewed under a 400X microscope.
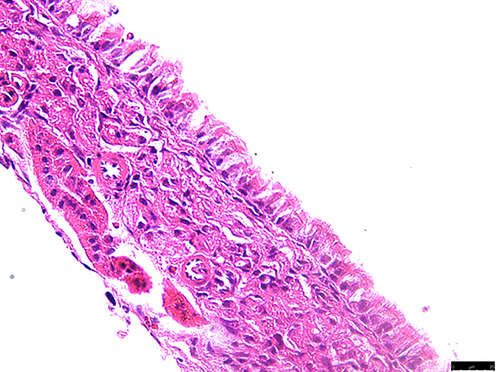
Figure 2 H&E staining results of the experimental group, viewed under a 400X microscope.
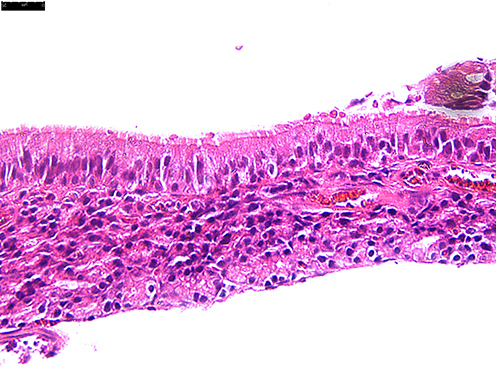
Figure 3 Comparison of serum IL-5 expression levels between experimental mice and control mice, **P < 0.01.
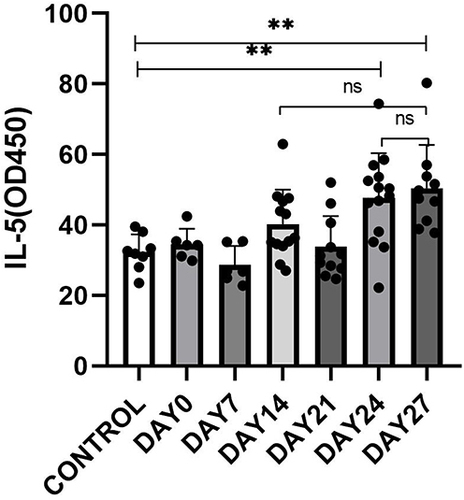
Figure 4 Comparison of serum IL-4 expression levels between experimental mice and control mice.*P<0.05, ***P<0.001.
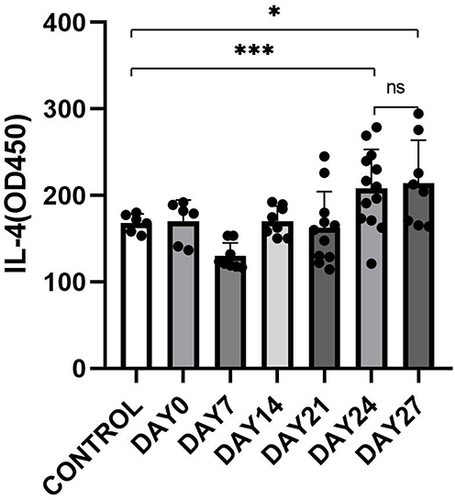
Figure 5 Comparison of serum house dust mite specific IgE antibody levels between experimental mice and control mice *P<0.05, **** P< 0.0001.
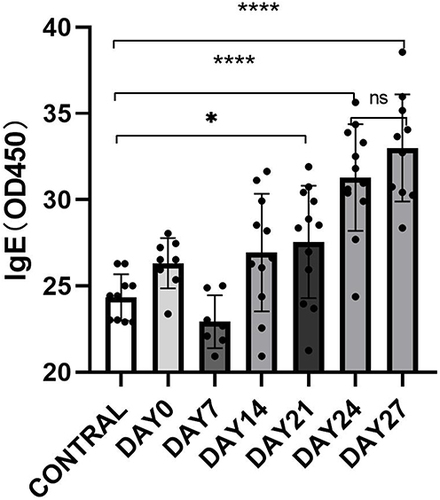
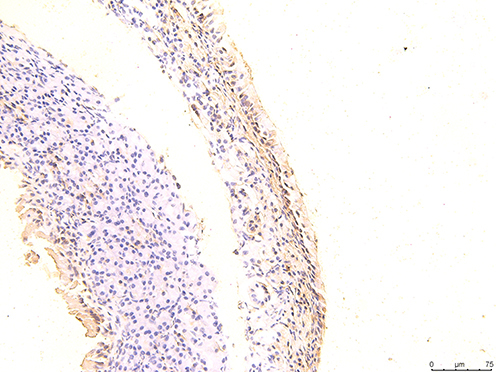
Figure 6 The immunohistochemical staining results of the control group were observed under 200X microscope.
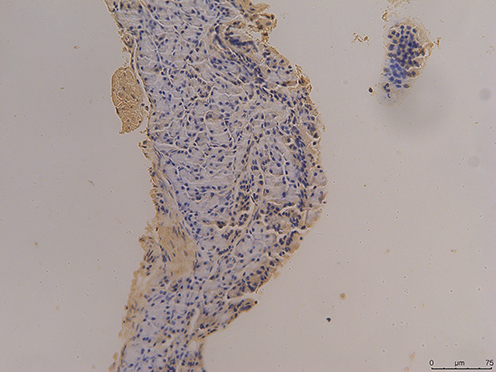
Figure 7 The immunohistochemical staining results of the day 0 group were observed under 200X microscope.
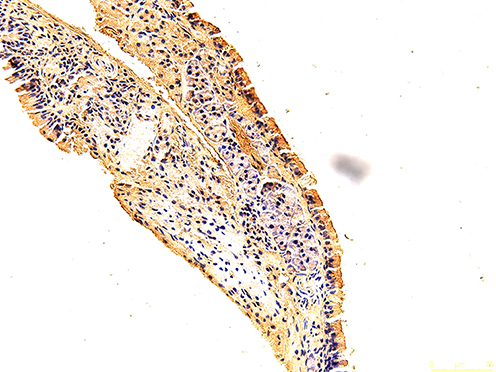
Figure 8 The immunohistochemical staining results of the day 7 group were observed under 200X microscope.
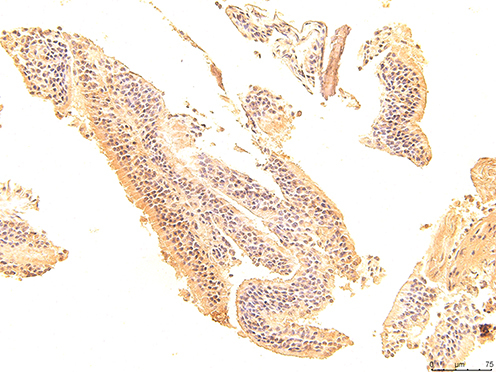
Figure 9 The immunohistochemical staining results of the day 14 group were observed under 200X microscope.
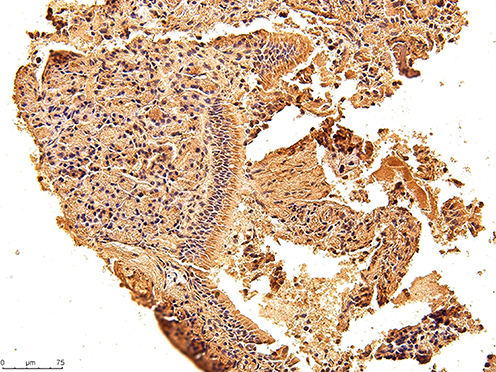
Figure 10 The immunohistochemical staining results of the day 21 group were observed under 200X microscope.
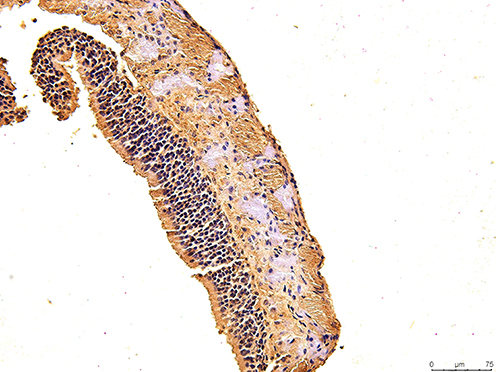
Figure 11 The immunohistochemical staining results of the day 24 group were observed under 200X microscope.
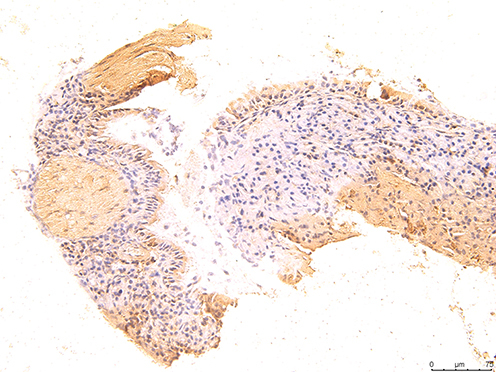
Figure 12 The immunohistochemical staining results of the day 27 group were observed under 200X microscope.