Figures & data
Figure 1 Resolvin D1 (RvD1) treatment ameliorates prostatic inflammation and pelvic pain associated with EAP. (A) The flow chart of the RvD1 treatment procedure. (B) Hematoxylin and eosin (H&E) staining showed that the infiltrating inflammatory cells in prostate tissues was significantly reduced in EAP mice after RvD1 treatment. (C) The histopathological scores of the mice in the EAP and RvD1 treatment groups. (D) Pain response frequency to mechanical stimulation of the mice in the EAP and RvD1 treatment groups. The data are shown as the mean ± SD and were analyzed by Kruskal–Wallis non-parametric test (C), or two-way ANOVA analysis (D). “ns” indicates P > 0.05; *P < 0.05; **P < 0.01; ****P < 0.0001.
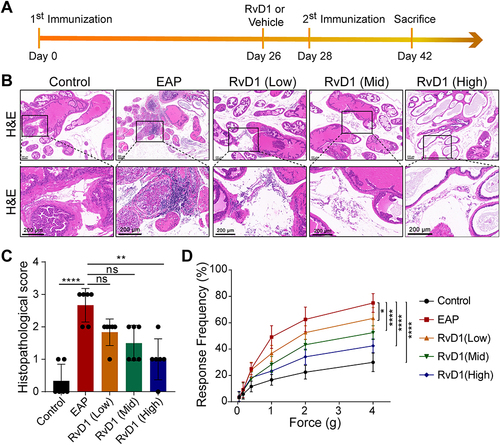
Figure 2 RvD1 treatment inhibits the activation of the NLRP3 inflammasome. (A) Western blotting assay to measure the protein levels of NLRP3, cleaved-IL-1β, pro-caspase-1, and cleaved-caspase-1 in prostate tissues of EAP and RvD1-treated mice. Statistical analysis of expression levels of NLRP3 (B), cleaved-IL-1β (C), pro-caspase-1, and cleaved-caspase-1 (D) detected by Western blotting assay. The data are shown as the mean ± SD and were analyzed by one-way ANOVA analysis. **P < 0.01; ***P < 0.001; ****P < 0.0001.
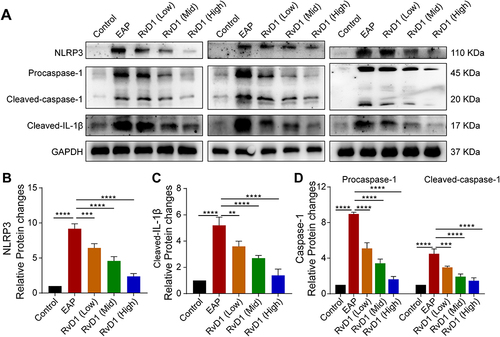
Figure 3 RvD1 inhibits oxidative stress and activates Nrf2/HO-1 pathway in EAP mice. (A) Dihydroethidium (DHE) staining to evaluate ROS production in prostate tissues of EAP- and RvD1-treated mice. (B) Quantification of DHE fluorescence intensity of each group (n = 6 per group). (C) Western blotting assay to measure the protein levels of Nrf2 and HO-1 in prostate tissues of EAP and RvD1-treated mice. Statistical analysis of expression levels of Nrf2 (D), and HO-1 (E) detected by Western blotting assay. (F and G) The levels of superoxide dismutase (SOD) and malonaldehyde (MDA) in the serum of EAP and RvD1-treated mice. (H) Pearson’s correlation coefficient analysis for the expression levels of Nrf2 and cleaved-IL-1β based on the results of Western blotting assay. (I) Pearson’s correlation coefficient analysis for the expression levels of HO-1 and cleaved-IL-1β based on the results of Western blotting assay. The data are shown as the mean ± SD and were analyzed one-way ANOVA analysis (B and D-G). “ns” indicates P > 0.05; *P < 0.05; **P < 0.01; ***P < 0.001; ****P < 0.0001.
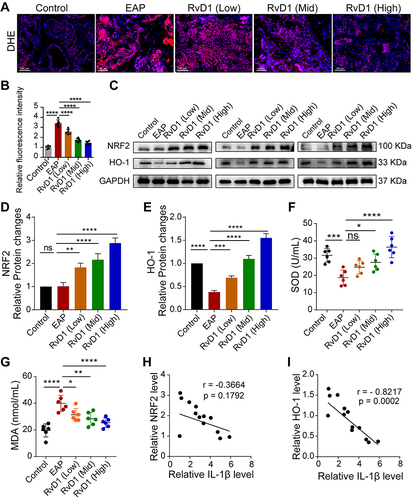
Figure 4 Pretreatment with ML385 or ZnPP reversed the inhibitory effects of RvD1 treatment on oxidative stress in mice. (A) Flow chart of the RvD1, ML385 or ZnPP treatment procedure. (B) DHE staining to evaluate ROS production in prostate tissues. (C) Quantification of DHE fluorescence intensity of each group (n = 6 per group). (D) Western blotting assay to measure the protein levels of Nrf2 and HO-1 in prostate tissues. Statistical analysis of expression levels of Nrf2 (E), and HO-1 (F) detected by Western blotting assay. (G and H) The expression levels of SOD and MDA in the serum of mice subjected to different treatments. The data are shown as the mean ± SD and were analyzed by one-way ANOVA analysis (C and E-H). “ns” indicates P > 0.05; *P < 0.05; **P < 0.01; ***P < 0.001; ****P < 0.0001.
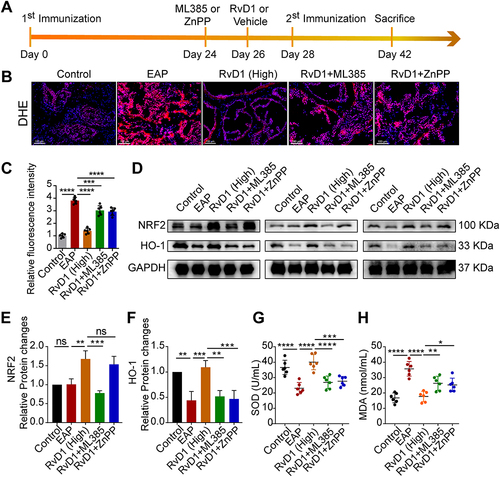
Figure 5 Pretreatment with ML385 or ZnPP offset the inhibitory effects of RvD1 treatment on NLRP3 inflammasome activation in mice. (A) Western blotting assay to measure the protein levels of NLRP3, cleaved-IL-1β, pro-caspase-1, and cleaved-caspase-1 in prostate tissues. Statistical analysis of expression levels of NLRP3 (B), cleaved-IL-1β (C), and pro-caspase-1, and cleaved-caspase-1 (D) detected by Western blotting assay. The data are shown as the mean ± SD and were analyzed by one-way ANOVA analysis. *P < 0.05; **P < 0.01; ***P < 0.001; ****P < 0.0001.
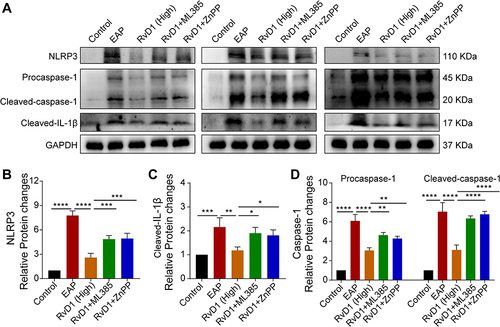
Figure 6 Pretreatment with ML385 or ZnPP reversed the anti-inflammatory effect of RvD1. (A) H&E showed increased inflammatory cell infiltration in prostate tissue in mice pretreated with ML385 or ZnPP compared with RvD1-treated mice. (B) The histopathological scores of mice subjected to different treatments. (C) Pain response frequency to mechanical stimulation of mice subjected to different treatments. (D) Enzyme-linked immunosorbent assays (ELISAs) were performed to measure the IL-1β, IL-6, and TNF-α levels in the serum of mice subjected to different treatments. The data are shown as the mean ± SD and were analyzed by Kruskal–Wallis non-parametric test (B), or two-way ANOVA analysis (C), or one-way ANOVA analysis (D). “ns” indicates P > 0.05; *P < 0.05; **P < 0.01; ***P < 0.001; ****P < 0.0001.
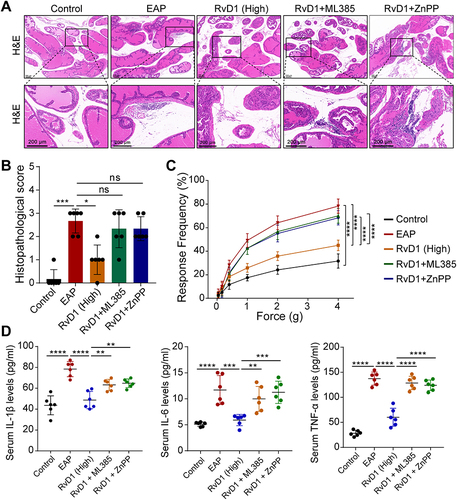
Figure 7 Schematic diagram of the therapeutic effect of RvD1 in mice with EAP and the underlying mechanism. RvD1 treatment alleviated prostatic inflammation and pelvic pain in the EAP model by activating Nrf2/HO-1 signaling to inhibit oxidative stress and NLRP3 inflammasome activation.