Figures & data
Figure 1 Different expression genes (DEGs) and immune cell type proportion in glom and tubule samples. (A). Volcano plots of DEGs in human renal glom dataset; (B). Volcano plots of DEGs in human renal tubule dataset; (C). The heatmap for DEGs in human renal glom dataset; (D). The heatmap for DEGs in human renal tubule dataset; (E). Venn diagram of common trend DEGs, a. up-regulated DEGs in renal tubule; b. up-regulated DEGs in renal glom; c. down-regulated DEGs in renal glom; d. down-regulated DEGs in renal tubule; (F). Different immune cell type proportion in DKD and Control, a: renal glom samples, b: renal tubule samples.
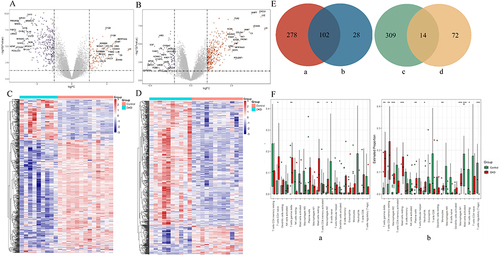
Figure 2 Integrated scRNA-seq dataset of diabetic and control samples. (A). T-distributed neighbor embedding (t-SNE) representation of cells from human snRNA-seq dataset; (B). The immune subsets extracted from human snRNA-seq dataset; (C). T-SNE representation of cells from mice scRNA-seq dataset; (D). The immune subsets from mice scRNA-seq dataset. Diabetic and control samples were integrated into a single dataset and clustered using Seurat.
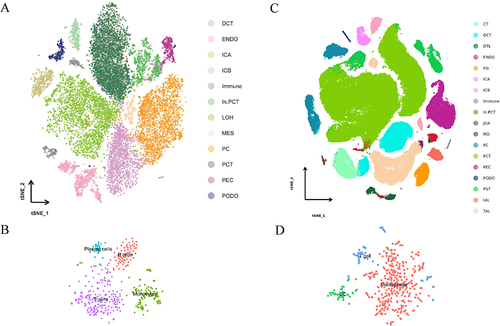
Figure 3 Different cell-type DEGs. (A). podocyte cell-type DEGs in human snRNA-seq dataset; (B). PCT cell-type DEGs in human snRNA-seq dataset; (C). In. PCT cell-type DEGs in human snRNA-seq dataset; (D). podocyte cell-type DEGs in mice scRNA-seq dataset; (E). PCT cell-type DEGs in mice scRNA-seq dataset; (F). In. PCT cell-type DEGs in mice scRNA-seq dataset. Differential gene expression analysis using the log-fold change expression versus the difference in the percentage of cells expressing the gene comparing DKD and control in podocytes, PCTs, and In. PCTs (∆ Percentage Difference). Gene labeled have log-fold change >0.5, ∆ |Percentage Difference| >10%, and P-value from Wilcoxon rank sum test <0.05.
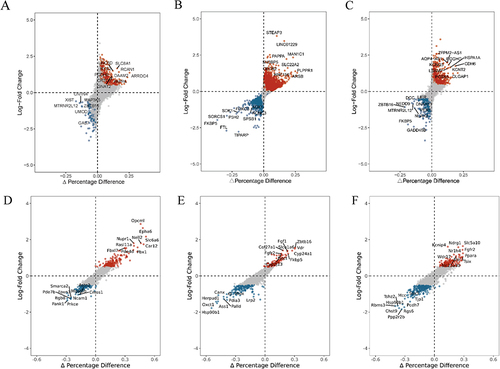
Figure 4 Functional enrichment analysis of common trend DEGs. (A) GO enrichment results of DEGs; (B). KEGG enrichment results of DEGs.
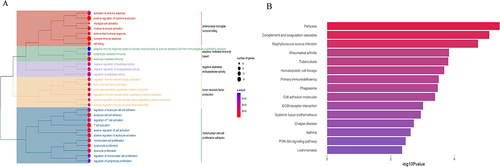
Figure 5 GO biological process enrichment results of cell-type DEGs. The x-axis represents the gene ratio, and the y-axis represents the GO terms. (A). GO biological process enrichment results of podocyte cell-type DEGs in human snRNA-seq dataset; (B). GO biological process enrichment results of PCT cell-type DEGs in human snRNA-seq dataset; (C). GO biological process enrichment results of In. PCT cell-type DEGs in human snRNA-seq dataset; (D). GO biological process enrichment results of podocyte cell-type DEGs in mice scRNA-seq dataset; (E). GO biological process enrichment results of PCT cell-type DEGs in mice scRNA-seq dataset; (F). GO biological process enrichment results of In. PCT cell-type DEGs in mice scRNA-seq dataset.
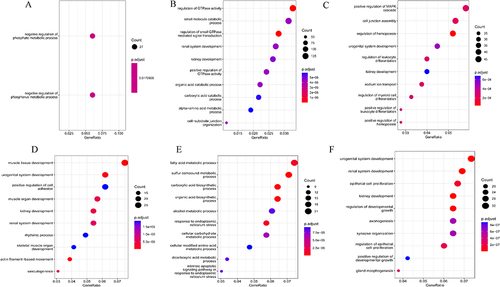
Figure 6 Gene sets enrichment analysis (GSEA) results. (A). GSEA results of podocytes in human snRNA-seq dataset; (B). GSEA results of PCT in human snRNA-seq dataset; (C). GSEA results of In. PCT in human snRNA-seq dataset; (D). GSEA results of PCT in mice scRNA-seq dataset; (E). GSEA results of In. PCT in mice scRNA-seq dataset.
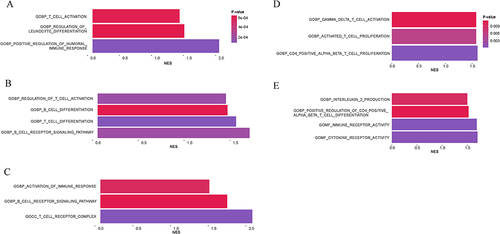
Figure 7 Changes in cell interaction number, strength under DKD condition and information flow. (A). Changes in cell interaction number and strength in DKD patients compared to healthy control, left: Differential numbers of interactions in human snRNA-seq dataset; right: Differential interactions strength in human snRNA-seq dataset; (B). Changes in cell interaction number and strength in DKD mice model: left: Differential numbers of interactions in mice scRNA-seq dataset; right: Differential interactions strength in mice scRNA-seq dataset; (C). Relative information flow in the human snRNA-seq dataset; (D). Relative information flow in mice scRNA-seq dataset. Nephron contains PEC, PCT, PST, In. PCT, DTL, TAL, MD, DCT; Ureteric contains CT, PC, ICA, ICB; Interstitial contains Fib, JGA; Glomerular contains PODO; Vascular contains ENDO. Red line: upregulated, blue line: downregulated. The thicker the line, the more significant the change.
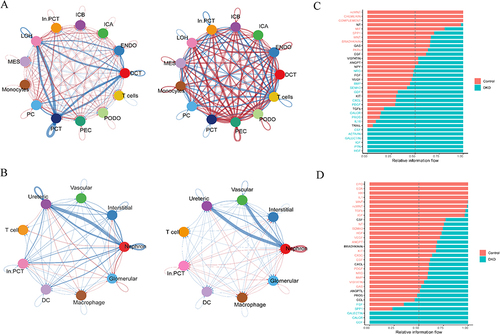
Figure 8 Upregulated information flow in different cell types and upregulated ligand-receptor pairs between immune and renal innate cell. (A) Upregulated information flow in different cell types in the human snRNA-seq dataset, left: Overall signaling patterns in control groups; right: Overall signaling patterns in DKD groups; (B) Upregulated information flow in the mice scRNA-seq dataset; left: Overall signaling patterns in control groups; right: Overall signaling patterns in DKD mice model groups; (C) Upregulated ligand-receptor pairs of DKD patients in human snRNA-seq datasets; left: Upregulated ligand-receptor pairs from innate cells to immune cells; right: Upregulated ligand-receptor pairs from immune cells to innate cells; (D) Upregulated ligand-receptor pairs in the DKD mice model scRNA-seq dataset; left: Upregulated ligand-receptor pairs from innate cells to immune cells; right: Upregulated ligand-receptor pairs from immune cells to innate cells.
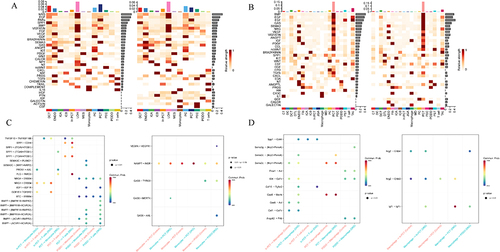
Figure 9 Different signaling pathways network and roles of different cells. (A) Different signaling pathways network in the human snRNA-seq dataset; (B) Different signaling pathways network in the mice scRNA-seq dataset.
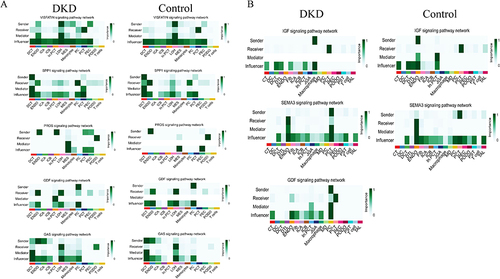
Figure 10 Related genes correlated with GFR.
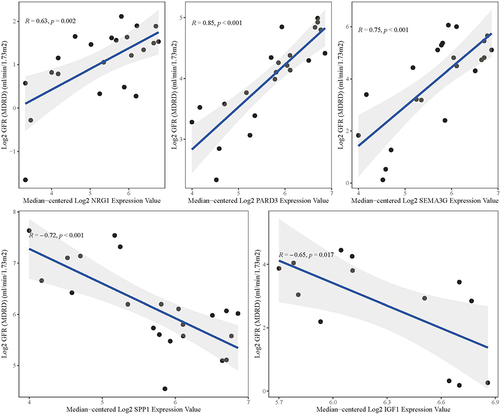
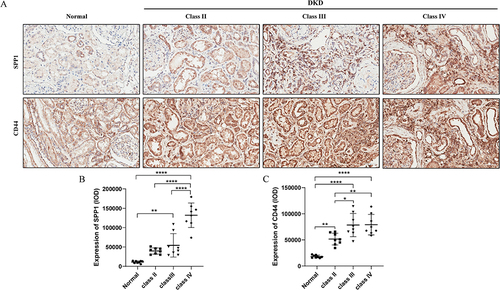
Figure 11 Expression of SPP1 and CD44 in renal tissues of healthy controls and DKD patients. (A) Representative immunohistochemical analysis of SPP1 and CD44 staining in healthy controls and DKD patients. Brown staining indicates the protein expression of SPP1 and CD44. Scale bar =50 µm; (B) Quantification of SPP1 immunohistochemical staining (n=8 in each group); (C) Quantification of CD44 immunohistochemical staining (n=8 in each group). *P<0.05, **P<0.005, ****P<0.0001.