Figures & data
Figure 1 Expression of TSG-6 and IL-6 in Thyroid associated ophthalmopathy (TAO) and non-TAO orbital tissues. The protein or mRNA was extracted from TAO (n=5) and non-TAO (n=4) orbital tissues. Experiments were performed in triplicate for each specimen. (A) Western blot and quantification analysis of TSG-6. Representative gel images were shown. (B) The tissue lysates were subjected to mRNA expression analysis to determine TSG-6 and IL-6 genes. Data in the columns indicate the mean density ratio ± SD, normalized to the level of GAPDH in the same sample. (**p < 0.01, ****p < 0.0001).
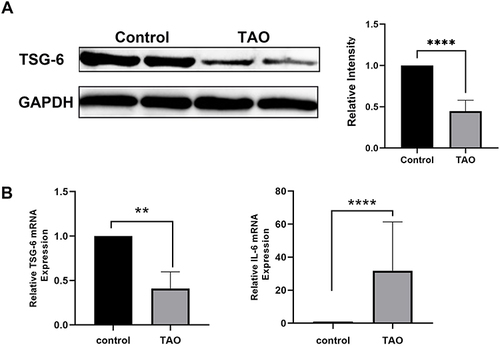
Figure 2 Construction and phenotype of TAO mouse model. (A) Experimental design. In order to evaluate the therapeutic effect of TSG-6 on TAO, female BALB/c mice were randomly divided into four groups. All mice at the age of 6 weeks were immunized with β-Gal (as control) or TSHR plasmid four times three weeks interval apart. One week after the fourth immunization, two groups of TSHR-immunized mice were treated with TSG-6 or dexamethasone once a week for three consecutive weeks. All mice were sacrificed at the age of 24 weeks. (B) Changes in mice body weight during the entire experiment. (C) Ocular symptoms in mice model of TAO. TSHR-immunized mice developed proptosis, eyelid inflammation or blepharodiastasis.
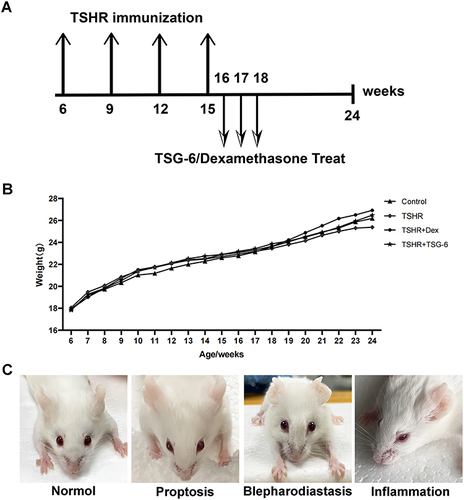
Figure 3 Detection of thyroid function in each group of mice and the immune histologically stained thyroid gland. (A) Serum total T4 levels were measured via competitive ELISA. (B) Serum TSHRAb were measured via double anti-sandwich ELISA. (C) The thyroid glands were fixed, paraffin embedded and sections of the middle thyroidal area where HE stained. TSHR-immunized mice developed hyperthyroidism, the glands proliferated, and the fluid in the follicles decreased. Representative images of normal and hyperthyroidism are shown (magnification x100 and x200). (D) Sections of the thyroid glands were immune histologically stained for CD3 and positive cells were counted. (E) Representative images of CD3 staining of each group are shown (magnification x200). Statistical analysis by one-way-ANOVA. *p < 0.05, **p < 0.01, ***p < 0.001, ****p < 0.0001.
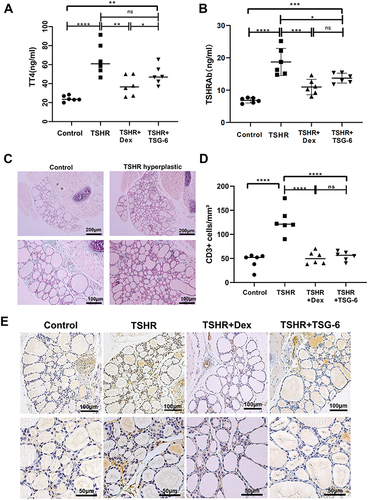
Figure 4 Histologic Features of the orbit from hTSHR A-Subunit Plasmid Immunized Mouse. The entire orbital tissues (including orbital bone) were fixed, decalcified, paraffin embedded and consecutive sections centered on the optic nerve were subjected to different staining procedures. (A) HE stain of orbit from control mice (x100). (B–D) HE stain of orbit from TSHR mice (x100). (B) Adipose tissue production increased. (C) Expansion of adipose tissue in retrobulbar fat (arrowed). (D) Muscle fibers were disturbed and the Intermuscular widened. (E and F) HE stain of orbit from TSHR-immunized mice treated by TSG-6 (x100). Lipogenesis and extraocular muscle hypertrophy were improved compared with the untreated group. (G) Immune histologically CD3 stained of EOM from TSHR mice (x200). Intense intermuscular T-lymphocytic infiltrate (arrowhead). (H) Immune histologically CD3 stained of EOM from TSG-6 treated mice (x200) indicates the reduction of inflammatory infiltration. (I–L) Masson stain (x100). Collagen fibers were dyed blue. Compared with the control group (I), the collagen fibers in the TSHR group (J and K) were increased, and the muscle fibers were separated by it (K, arrowhead). But the TSG-6 treatment group (L) relieved. (M and N) Periodic Acid-Schiff stain (x40). (O and P) Periodic Acid-Schiff stain (x100). Mucopolysaccharide substances in tissues appear purplish-red. Compared with the control group (M and O), the extracellular matrix accumulation in the TSHR group (N and P) increased (arrowhead).
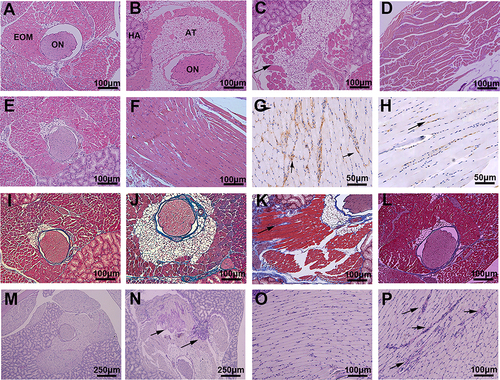
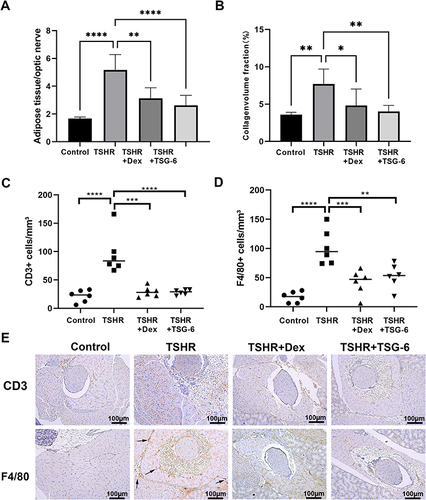
Figure 5 Orbital inflammatory cell infiltration and tissue fibrosis were reduced by TSG-6 treatment. (A) The ratio of adipose tissue area to optic nerve area reflects the degree of lipogenesis. (B) The production of collagen fibers was evaluated via Masson stain and is reported as a percentage of collagen volume fraction. (C) The number of CD3+ cells were counted in the orbital section Immunohistochemistry stain of CD3. (D) The number of F4/80+ cells were counted in the orbital section Immunohistochemistry stain of F4/80. (E) Representative images of each group orbital section CD3 and F4/80 staining are shown (x100), and the infiltration of macrophages were pointed by the arrow. Statistical analysis by one-way-ANOVA. (*p < 0.05, **p < 0.01, ***p < 0.001, ****p < 0.0001).