
Figures & data
Table 1 The Information of Datasets
Figure 1 Flow chart of the study.
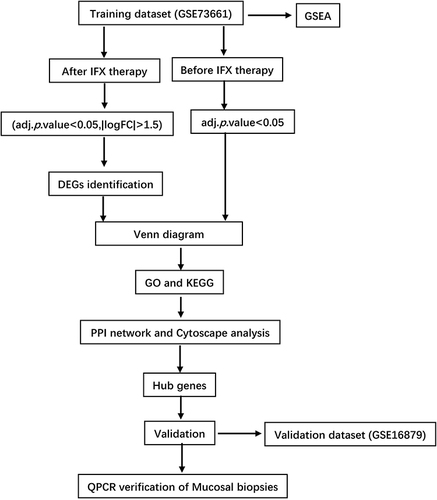
Table 2 Baseline Clinical Characteristics of Ulcerative Colitis Patients
Table 3 Primers for RT-PCR
Figure 2 Identification of DEGs. (A) The volcano plots of all DEGs after IFX therapy in GSE73661. (B) The volcano plots of genes with statistical differences before IFX therapy. (C) Venn diagram of the overlapping genes. The significant DEGs were identified with the threshold: adjust P value <0.05 and |log2 (Fold Change) |>1.5. Genes with statistical differences were defined as adjusted P value <0.05. Blue and red spots represent downregulated and upregulated genes in non-responders compared to responders.
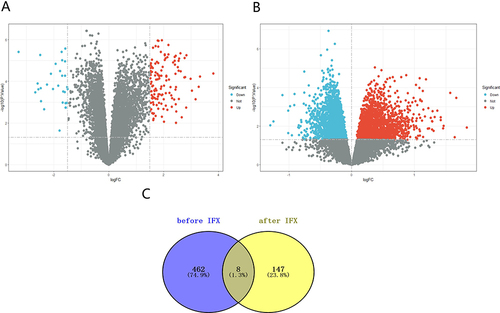
Figure 3 Functional enrichment analysis of the DEGs. (A) Gene Ontology (GO) analysis of DEGs. (B) Kyoto Encyclopedia of Genes and Genomes (KEGG) pathway enrichment analysis for DEGs.
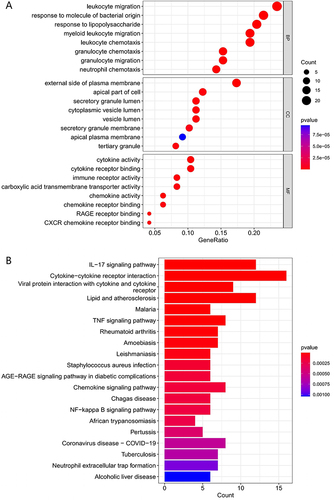
Figure 4 Gene set enriched in chemokine signaling pathway (FDR < 0.001, NES = 2.42, adj. p-value < 0.001), gene set enriched in cell adhesion molecules cams (FDR < 0.001, NES =2.29, adj. p-value < 0.001), gene set enriched in cytokine-cytokine receptor interaction (FDR < 0.001, NES = 2.51, adj. p-value < 0.001), gene set enriched in TOLL like receptor signaling pathway (FDR < 0.001, NES = 2.42, adj. p-value < 0.001), gene set enriched in NOD-like receptor signaling pathway (FDR < 0.001, NES = 2.40, adj. p-value < 0.001), gene set enriched in JAK-STAT signaling pathway (FDR < 0.001, NES = 2.18, adj. p-value < 0.001). Screening criteria for significant gene sets included adj. p-value < 0.05 and FDR < 0.25.
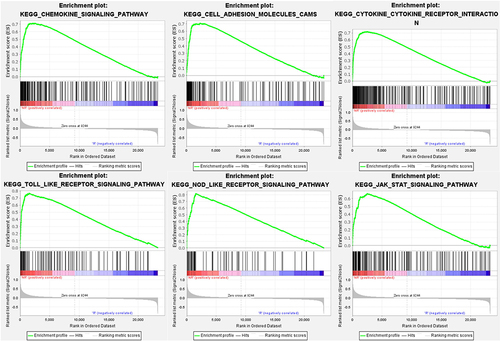
Figure 5 Protein-Protein Interaction Network. The network was constructed and visualized through the Cytoscape software. (A) PPI network. The nodes represent proteins, and the edges represent their interaction. (B–D) MCODE sub-network, including cluster 1 and cluster 2. (E and F) Cytohubba-Degree was used to identify hub genes in the network. (G) The master regulator predicted by the iRegulon tool is highlighted in green, and the target genes are in purple.
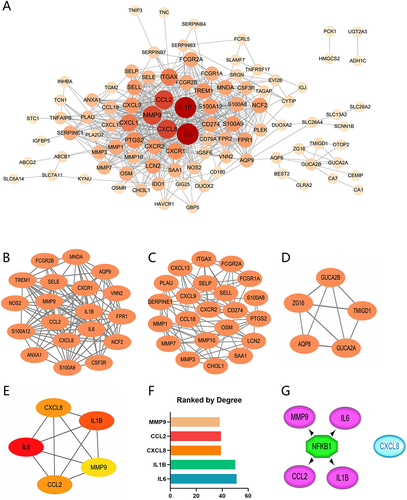
Figure 6 The expression of hub genes was examined by RT-PCR, and GAPDH served as an internal reference. (A) Differential gene expression analysis in the GSE16879 validation dataset. (B–F) RT-PCR analysis. *P<0.05, **P<0.01, ***P<0.001, and ns, no significance.
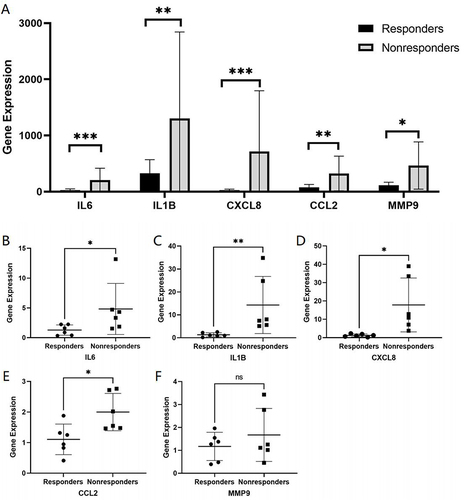
Table 4 The Drugs Approved to Interact with Target Genes
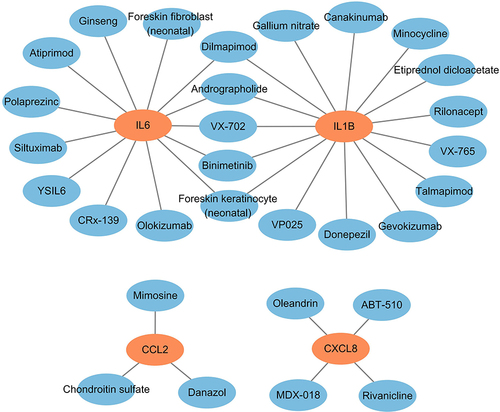
Figure 7 Drug-gene interaction network of target genes. Drugs are in blue, and target genes are in Orange.
Data Sharing Statement
The datasets analyzed during the current study are available in the Gene Expression Omnibus (GEO) datasets (https://www.ncbi.nlm.nih.gov/geo/). And the authors confirm that the data supporting the findings of this study are available within the article.