Figures & data
Table 1 Clinical Characteristics of the Study Population
Table 2 The Association Between Inflammatory Markers and Cervical Cerclage Outcomes
Table 3 Relationships Between the Inflammatory Markers and Maternal-Neonatal Outcomes
Figure 1 Cut-off, the optimal novel systemic inflammation markers level is used to predict the outcome of cervical cerclage according to the ROC curve. (A) Pre-SII level; (B) Pre-SIRI level; (C) Post-SII level; (D) Post-SIRI level; (E) ΔSII level; (F) ΔSIRI levels.
Note: ΔMeans Pre-SII/SIRI minus Post-SII/SIRI.
Abbreviations: SII, systemic immune inflammation index; SIRI, systemic inflammation response index; AUC, the area under the ROC curve; CI, confidence interval.
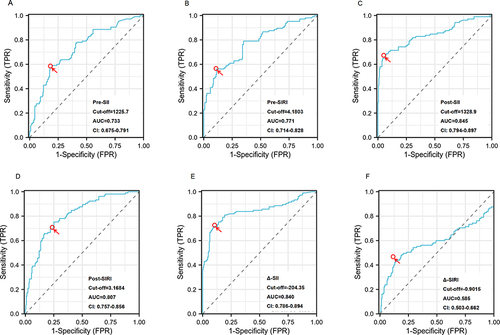
Table 4 Diagnostic Accuracy of the Inflammatory Markers for the Outcomes of Cervical Cerclage
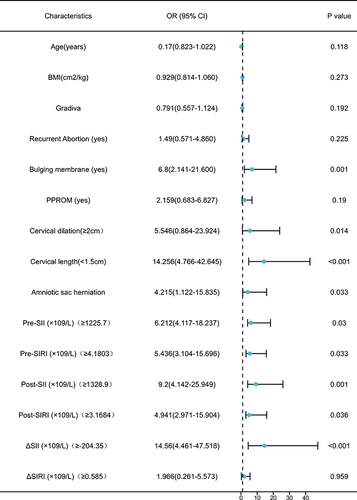
Figure 2 Independent risk factors for predicting the unsuccessful cervical cerclage.
Note: ΔMeans Pre-SII/SIRI minus Post-SII/SIRI.
Abbreviations: SII, systemic immune inflammation index; SIRI, systemic inflammation response index; BMI, body mass index; PPROM, preterm premature rupture of membranes; OR, odds ratio, CI, confidence interval.