Figures & data
Figure 1 Flow chart for this study.
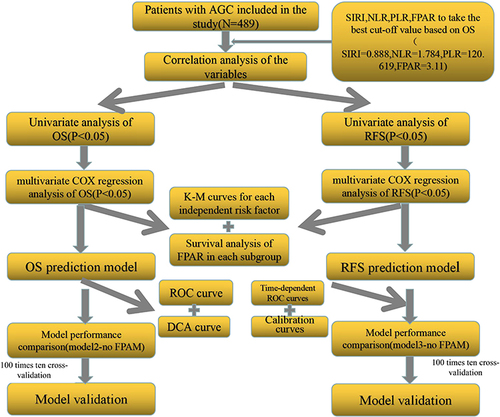
Table 1 Baseline Clinicopathological Characteristics of the Enrolled Patients
Table 2 Association of FPAR with Clinicopathological Features
Figure 2 Heat map for correlation analysis between variables.
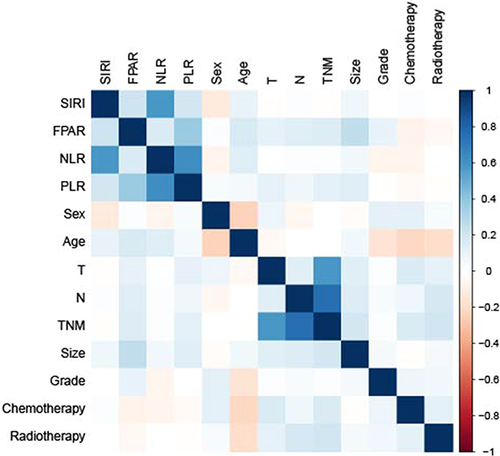
Table 3 Univariate and Multivariable Cox Analysis of OS in AGC
Table 4 Univariate and Multivariable Cox Analysis of RFS in AGC
Figure 3 Kaplan–Meier curves of OS and RFS in each independent risk factor.(A). K-M curves of OS in FPAR; (B). K-M curves of OS in Grade; (C). K-M curves of OS in N-stage; (D). K-M curves of OS in TNM-stage; (E). K-M curves of OS in chemotherapy; (F). K-M curves of RFS in FPAR; (G). K-M curves of RFS in Grade; (H). K-M curves of RFS in N-stage;(I). K-M curves of RFS in TNM-stage; (J). K-M curves of RFS in chemotherapy).
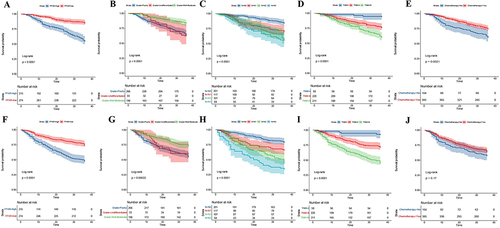
Figure 4 Kaplan–Meier curve of OS and RFS in each subgroup(A). FPAR for OS in TNM-stage; (B). FPAR for RFS in TNM-stage; (C). OS in stage II and III FPAR patients; (D). RFS in stage II and III FPAR patients).
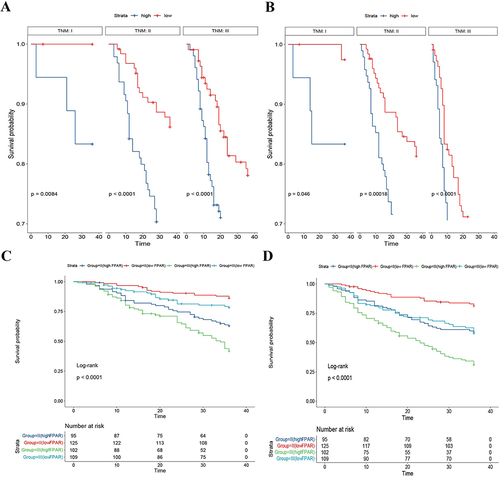
Table 5 Before and After Evaluation of 100 Cross-Validations of the Model
Figure 5 Prognostic nomograms with FPAR for predicting survival of AGC patient.(A). OS prediction model; (B). RFS prediction model).
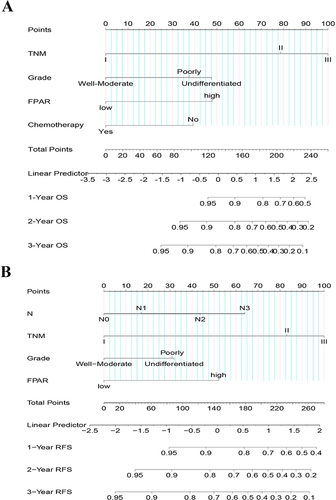
Figure 6 Evaluation of predictive models with calibration curves, DCA, ROC(A). Calibration curves for OS prediction models; (B). DCA for OS prediction models; (C). ROC for OS prediction models; (D). Calibration curves for RFS prediction models; (E). DCA for RFS prediction models; (F). ROC for RFS prediction models).
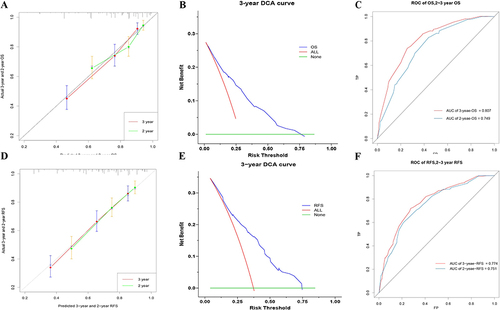
Figure 7 Visualisation of cross-validation results for predictive models,(A). OS predictive model cross-validation visualisation of cloud and rain plots; (B). RFS predictive model cross-validation visualisation of cloud and rain plots; (C). C-index before correction for OS and RFS prediction models; (D). C-index after correction for OS and RFS prediction models).
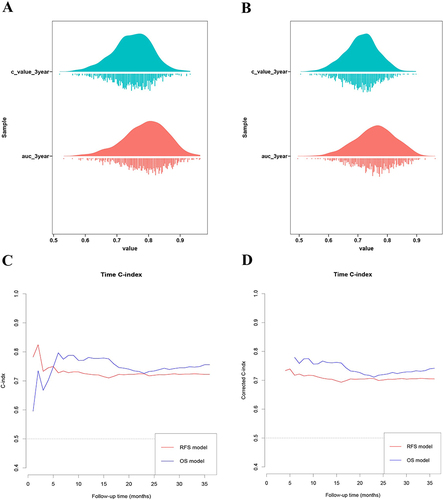
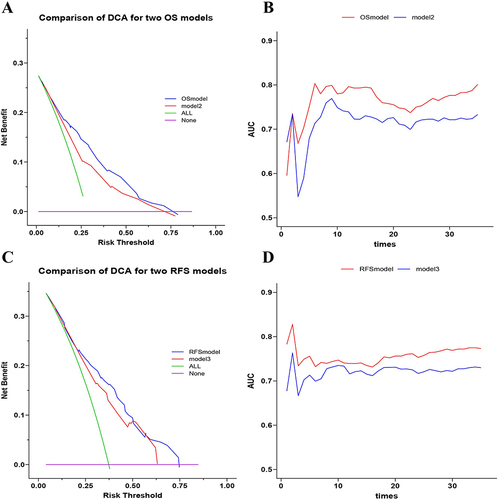
Figure 8 Evaluation of prognostic nomograms with or without FPAR for predicting survival of AGC patient.(A). Comparing DCA of OS model and model2; (B). Comparing ROC AUC of OS model and model2; (C). Comparing DCA of RFS model and model3; (D). Comparing ROC AUC of RFS model and model3). (model2-OS without FPAR;model3-RFS without FPAR).