Figures & data
Figure 1 Simplified schematic diagram of the pathologic cycle in obesity-induced NAFLD/MAFLD resulting from multiple parallel hits.
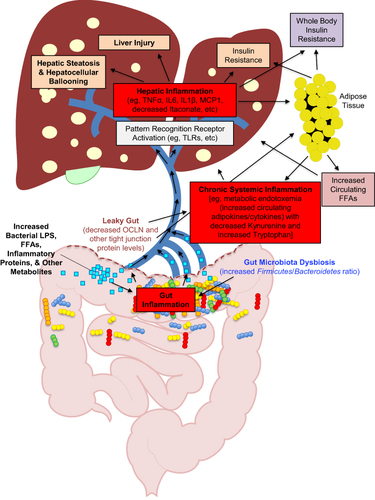
Figure 2 Derivation and structure of IOI-214 from C10.
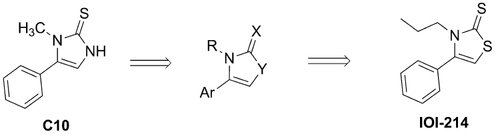
Figure 3 Synthesis of 3-propyl-4-(pyridin-3-yl)thiazole-2(3H)-thione (IOI-214).
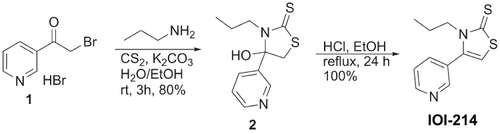
Figure 4 IOI-214 prevents LPS-induced inflammation in murine macrophages and hepatocytes in culture.
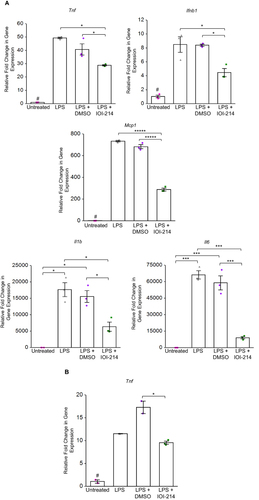
Figure 5 IOI-214 blocks HF diet-induced mesenteric fat accumulation without affecting HF diet-induced weight gain or subcutaneous fat accumulation.
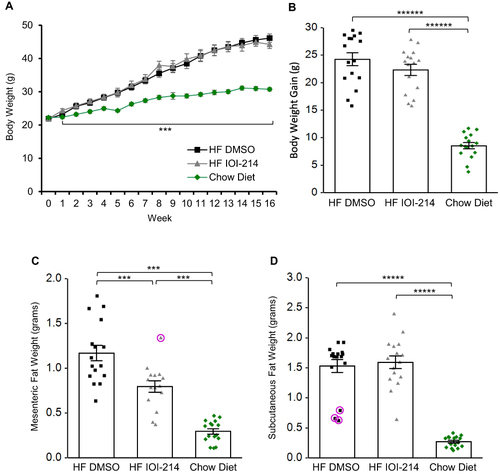
Figure 6 Continued.
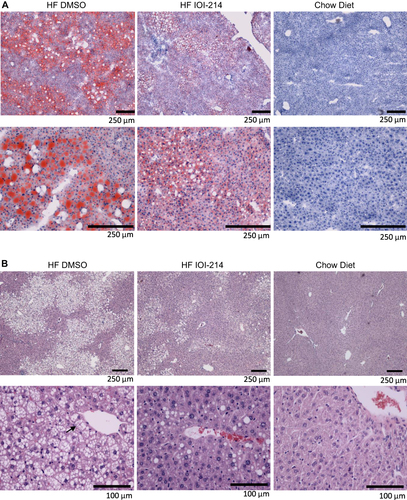
Figure 6 IOI-214 ameliorates HF diet-induced hepatic steatosis.
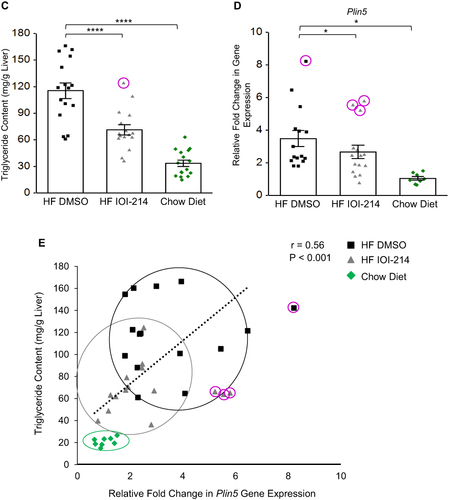
Figure 7 IOI-214 mitigates HF diet-induced fasting hyperglycemia, without affecting fasting serum insulin, cholesterol or triglyceride levels, or glucose intolerance.
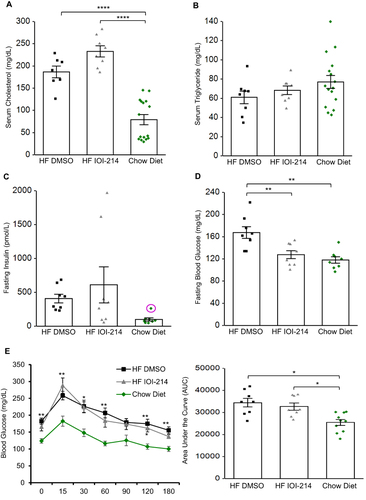
Figure 8 IOI-214 blocks HF diet-induced hepatic inflammatory cytokine and chemokine protein levels in vivo.
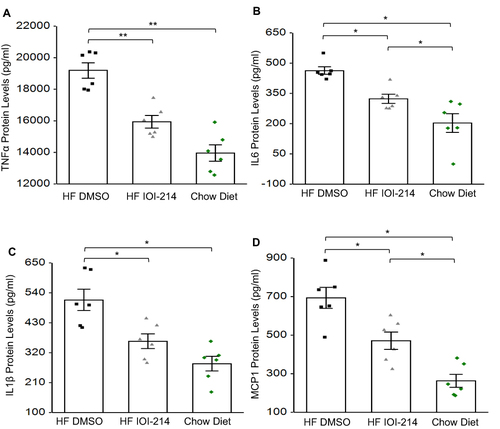
Figure 9 Correlations between hepatic TG content and inflammatory cytokine and chemokine protein levels in the liver of HF DMSO, HF IOI-214 and Chow Diet mice.
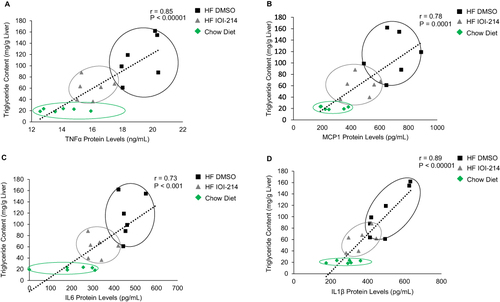
Table 1 Effects of IOI-214 on Key Metabolites Related to Inflammation
Figure 10 IOI-214 improves gut microbiota dysbiosis in HF diet-fed mice.
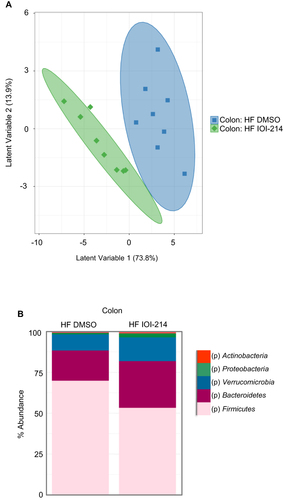
Figure 11 IOI-214 decreases gut permeability in HF diet-fed mice.
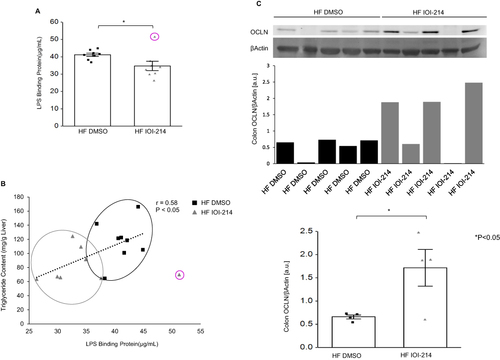
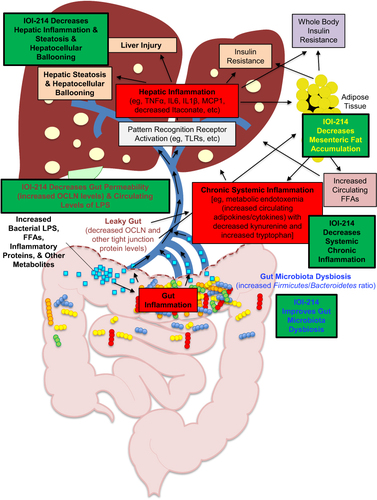
Figure 12 Hypothesized working model of IOI-214 activity to ameliorate HF diet-induced NAFLD/MAFLD in vivo.