Figures & data
Figure 1 Effects of NSC-Exos on neurobehavior in rats after MCAO. (A) Longa scores were evaluated at 1d, 3d, 7d and 14d in each group. There was no obvious neurological abnormality in normal rats, but MCAO rats had different degrees of neurological dysfunction. (B) Balance ability test was evaluated at 1d, 3d, 7d and 14d in each group. The normal rats could pass quickly and smoothly, but most of the MCAO rats fell within 30s and could not pass the bar (*P<0.05 vs Sham group; #P<0.05 vs IRI group; &P<0.05 vs PBS group).
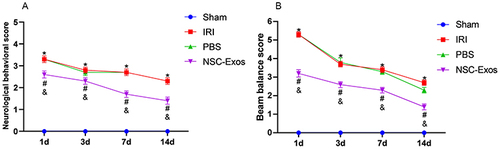
Figure 2 Effects of NSC-Exos on the cognitive ability in rats after MCAO. The escape latency and the exploration time of the target quadrant in MCAO rats increased, but NSC-Exos treatment reversed the outcome and improved spatial learning and memory function. (A) The time of the latency period. MCAO rats had significantly longer escape latency, learning memory and navigation ability were impaired. (B) The time spent in the target quadrant. The time spent in the target area was prolonged after treatment, and less time was spent exploring target quadrant. (C) The trajectory diagram of rats in each group. The directionality of the trajectory of normal rats were clear, while the injured rats were chaotic (*P<0.05 vs Sham group; #P<0.05 vs IRI group; &P<0.05 vs PBS group).
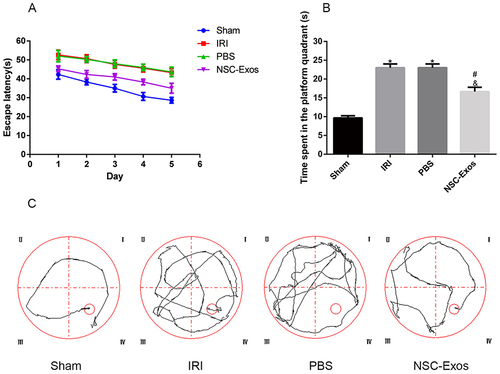
Figure 3 Effects of NSC-Exos on cerebral infarct size in rats after MCAO. The brain tissue of normal rats was red, without obvious infarct areas, and the structure was well symmetric. Injured rats showed obvious white infarcts. After NSC-Exos treatment, the infarct size was reduced, and a small part of white infarcts were seen. (A) Representative cerebral infarcts stained with TTC solution. (B) Quantitative analysis of infarct size. Administration of NSC-Exos reduced the infarct size. Calculated as: Infarct size (%) = (contralateral hemisphere area - ipsilateral non-infarct area) / contralateral area × 100% (**P<0.01 vs Sham group; ##P<0.01 vs IRI group; &&P<0.01 vs PBS group).
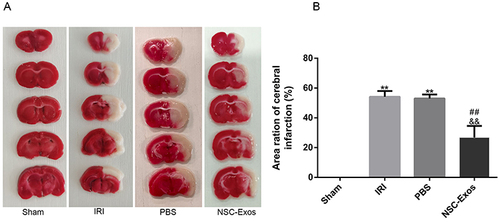
Figure 4 Co-localization of PKH26-labeled NSC-Exos and MAP-2 positive cells in parietal cortex. Red fluorescence indicates PKH26-labeled exosomes, pink fluorescence indicates MAP-2 positive neurons and blue fluorescence indicates nuclei. Labeled exosomes were localized in the cytoplasm of MAP-2 positive cells, indicating that exosomes were successfully taken up by neuronal cells (The white arrow indicates the co-localized expression of PKH26 and MAP-2 positive cells, Scale bar=20μm).
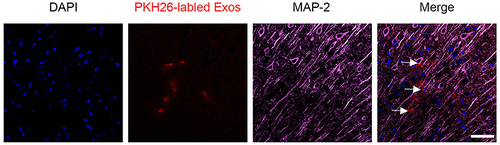
Figure 5 Immunohistochemical staining of Iba1 in the parietal cortex. (A) Iba1 staining results in each group on 1d, 3d, 7d, and 14d. MCAO rats had more various branches and hypertrophic cells, while NSC-Exos treatment decreased the number of branches and somatic cells. (B) Statistical diagram of Iba1+ cells. Microglia were activated rapidly after stroke, MCAO rats were increased Iba1+ cells, while NSC-Exos treatment significantly reduced Iba1+ cells (**P<0.01 vs Sham group; ##P<0.01, #P<0.05 vs IRI group; &&P<0.01, &P<0.05 vs PBS group, Scale bar=20μm).
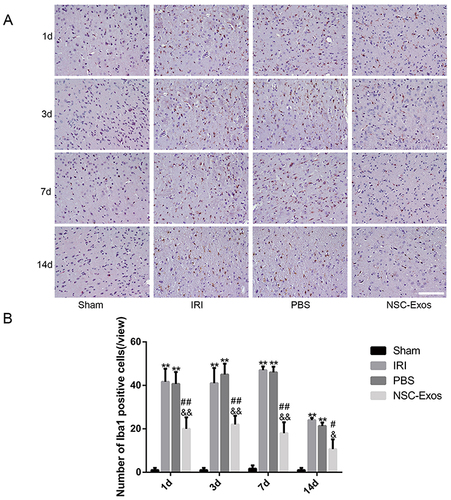
Figure 6 Representative images of parietal cortex co-stained with CD86 and Iba1. (A–D) Representative co-stained images of CD86 and Iba1 on 1d, 3d, 7d, and 14d, green fluorescence indicates Iba1, red fluorescence indicates CD86, and blue fluorescence indicates nuclei. There was almost no co-staining in the sham group. CD86+/Iba1+ cells significantly increased after MCAO, and CD86+/Iba1+ cells gradually decreased after NSC-Exos treatment. NSC-Exos reduced the expression of M1-state markers. (A) At 1d, many CD86 cells appeared. (B) At 3d, CD86 continued to be highly expressed. (C) At 7d, the expression was slightly reduced. (D) At 14d, the expression was lower than that at 7d. (E–H) The proportion of CD86+/Iba1+ in Iba1+ at 1d, 3d, 7d, and 14d in turn. CD86+/Iba1+ was abundantly expressed in the infarcted cortex at 1d and 3d after MCAO, its expression was slightly reduced at 7d and 14d. NSC-Exos treatment decreased the CD86+/Iba1+ cells (**P<0.01 vs Sham group; ##P<0.01, #P<0.05 vs IRI group; &&P<0.01, &P<0.05 vs PBS group, Scale bar=20μm).
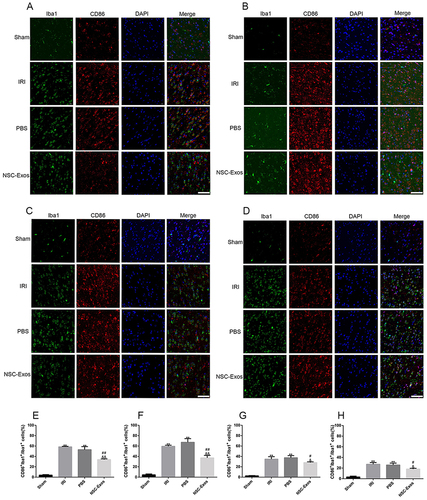
Figure 7 Representative images of parietal cortex co-stained with CD206 and Iba1. (A–D) Representative co-stained images of CD206 and Iba1 on 1d, 3d, 7d, and 14d, green fluorescence indicates Iba1, red fluorescence indicates CD206, and blue fluorescence indicates nuclei. There was almost no co-staining in the sham group, and the CD206+/Iba1+ cells increased after MCAO. After NSC-Exos treatment, CD206+/Iba1+ cells were significantly increased at 1d, 3d, 7d, and 14d, which promoted the expression of M2-state markers. (A) At 1d, a small amount of CD206 cells was expressed. (B) At 3d, the expression of CD206 began to increase. (C) At 7d, it continued to increase. (D) At 14d, CD206 was highly expressed. (E–H) The proportion of CD206+/Iba1+ in Iba1+ at 1d, 3d, 7d, and 14d in turn. CD206+/Iba1+ cells began to increase at 1d, and continued to increase at 3d, 7d, and 14d (**P<0.01 vs Sham group; ##P<0.01; &&P<0.01 vs PBS group, Scale bar=20μm).
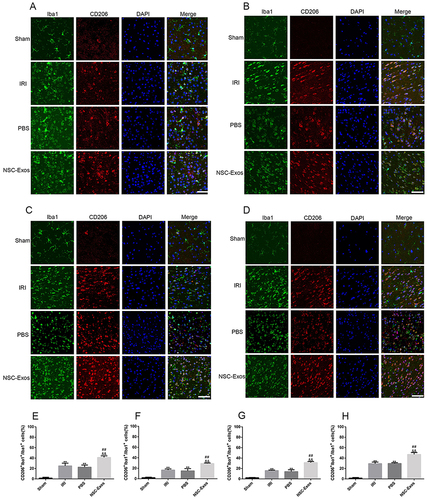
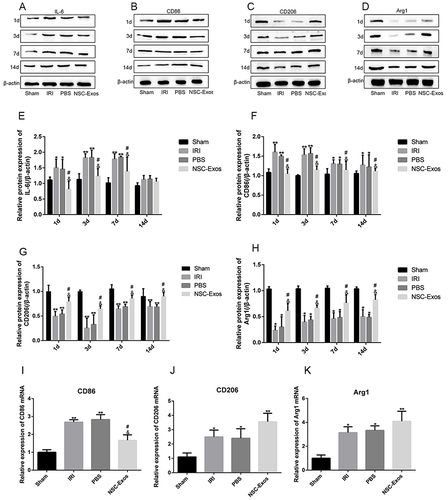
Figure 8 NSC-Exos ameliorated local inflammatory microenvironment in parietal cortex after MCAO. (A–D) IL-6, CD86 (pro-inflammatory factors), and CD206, Arg1 (anti-inflammatory factors) in the infarct area were detected by Western blot. The results were calculated in gray value and displayed as target protein bands and internal reference bands. (A) Western blot analysis of IL-6 (B) Western blot analysis of CD86. (C) Western blot analysis of CD206. (D) Western blot analysis of Arg1. (E–H) The relative protein expression statistics of IL-6, CD86, CD206, and Arg1 in sequence. From the 1d after stroke, the production of IL-6 and CD86 increased significantly. After NSC-Exos treatment, the expression of IL-6 and CD86 was reduced, while the expression of CD206 and Arg1 increased. (I–K) On 3d, mRNA expression of M1/M2 markers was detected by q-PCR. (I) q-PCR analysis of CD86 mRNA level. (J) q-PCR analysis of CD206 mRNA level. (K) q-PCR analysis of Arg1 mRNA level (**P<0.01, *P<0.05 vs Sham group; #P<0.05 vs IRI group; &P<0.05 vs PBS group).