
Figures & data
Figure 1 Radiographic, histological and cellular characteristics of healthy controls, gingivitis patients and periodontitis patients. (A) Panoramic radiographs of healthy control, gingivitis and periodontitis samples. (B) Hematoxylin and eosin staining of gingival tissues (original magnification ×100, scale bar = 100 μm; local magnification ×400, scale bar = 10 μm). (C) Comparison of EDA+FN expression among different gingival tissues (original magnification ×100, scale bar = 100 μm; local magnification ×400, scale bar = 10 μm). (D) The Trap+MNCs induced by fibroblasts isolated from the healthy control, gingivitis and periodontitis groups (original magnification of ×200, scale bar = 50 μm). (E) Comparison of Trap+MNCs induced by fibroblasts among the three groups. (*P < 0.05) (F) Relative expression of EDA+FN among the three groups. (G) Relative expression of other osteoclastogenesis-related genes as well as the RANKL/OPG ratio among the three groups. (*P < 0.05; **P < 0.01).
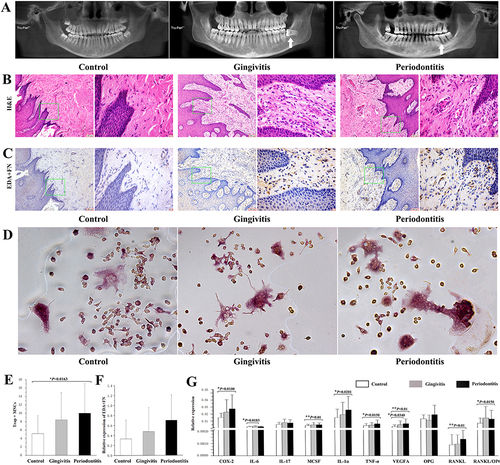
Table 1 Correlation Between EDA+FN Expression (IOD) and Periodontal Conditions
Figure 2 Clustering analysis of the colony forming units (CFUs) of fibroblasts. (A) The fibroblast aggregations of colony formation units (CFUs) from healthy controls, gingivitis patients and periodontitis patients (original magnification of ×40x, scale bar = 200 μm). (B) CFUs formed from 1000 cells isolated from the three groups. (C) Thermogram indicating the different expression of genes in each CFU. (D) Factor loading of the assessed osteoclastogenesis-related genes in PC1, PC2 and PC3. (E) Each pellet with a number represents the median position of its corresponding CFU in the PC1, PC2, and PC3 coordinate system, in which CFUs were divided into four clusters (yellow pellet, CFUs of Cluster 1; red pellet, CFUs of Cluster 2; blue pellet, CFUs of Cluster 3; and green pellet, CFUs of Cluster 4).
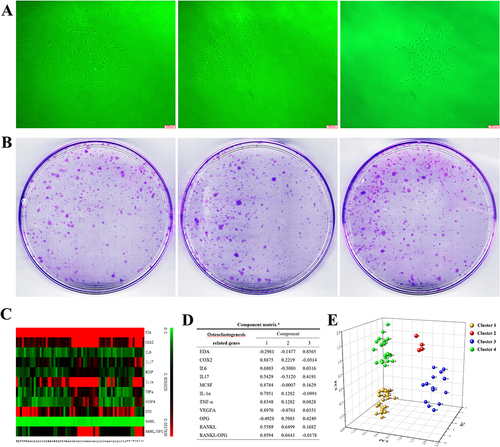
Figure 3 Osteoclastogenic induction of single cultured or cocultured clusters. (A) Trap+MNCs induced by fibroblasts of various clusters (original magnification of ×200, scale bar = 50 μm). (B) Comparison of Trap+MNCs induced by fibroblasts of different clusters. (**P < 0.01) (C) Relative expression of EDA+FN among the four clusters. (**P < 0.01) (D) Relative expression of other osteoclastogenesis-related genes as well as the RANKL/OPG ratio among Clusters. (*P < 0.05; **P < 0.01) (E) Comparison of the effects of intercellular interaction on the induction of Trap+MNCs by coculturing fibroblasts in which Clusters 1, 3, and 4 interacted with each other (original magnification of ×200, scale bar = 50 μm). (*P < 0.05).
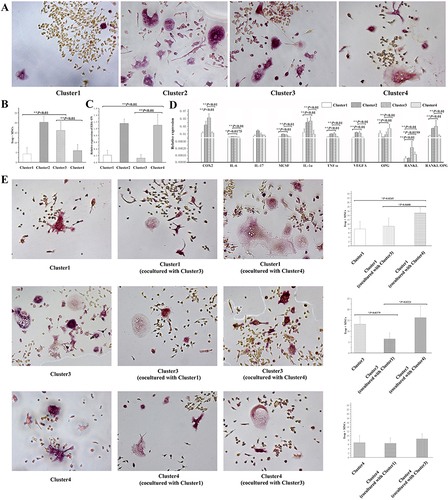
Figure 4 Effects of EDA knockout Cluster 4 on osteoclastogenic induction. (A) PCR product bands from EDA knockout fibroblasts of Cluster 4 (415 bp) and untreated cells (675 bp). (B) The protein levels of EDA+FN and total FN in EDA knockout and untreated cells were detected by Western blot analysis. (C) The Trap+MNCs induced by fibroblasts of Cluster 1 alone and Cluster 1 cocultured with Cluster 4 or EDA knockout Cluster 4. (original magnification of ×200, scale bar = 50 μm). (D) Comparison of osteoclastogenic induction among the differently cultured Cluster 1 fibroblasts. (*P < 0.05). (E) Trap+MNCs induced by fibroblasts of Cluster 3 alone and Cluster 3 cocultured with Cluster 4 or EDA knockout Cluster 4 (original magnification of ×200, scale bar = 50 μm). (F) Comparison of osteoclastogenic induction among differently cultured Cluster 3 fibroblasts. (**P < 0.01). (G) Relative expression of osteoclastogenesis-related genes in differently cultured Cluster 1 fibroblasts. (*P < 0.05; **P < 0.01). (H) Relative expression of osteoclastogenesis-related genes in differently cultured Cluster 3 fibroblasts. (*P < 0.05; **P < 0.01). (I) In experimental periodontitis, osteoclasts in the furcation area on Days 3 and 7 after ligature placement, including the control and EDA knockout cell groups. (J) Micro-CT-based analyses of remaining bone volume in the furcation area and alveolar bone loss (scale bar = 1 mm). (K) Comparison of the number of osteoclasts in the furcation area on Days 3 and 7 among groups. (*P < 0.05; **P < 0.01). (L1–L3) Micro-CT-based quantification of the bone volume at the furcation area, alveolar bone loss area, and depth. (*P < 0.05; **P < 0.01).
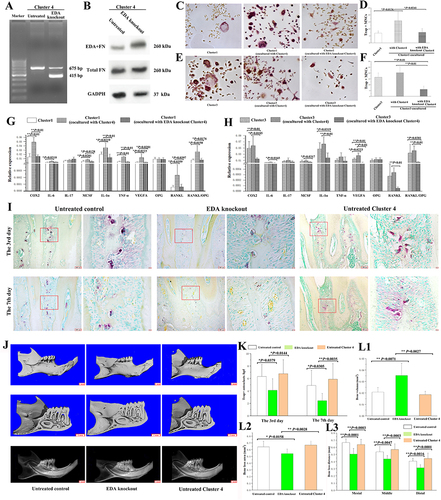
Table 2 Comparison of Bone Volume in Furcation Area and Bone Loss Area and Depth