
Figures & data
Figure 1 Flow chart of the study.
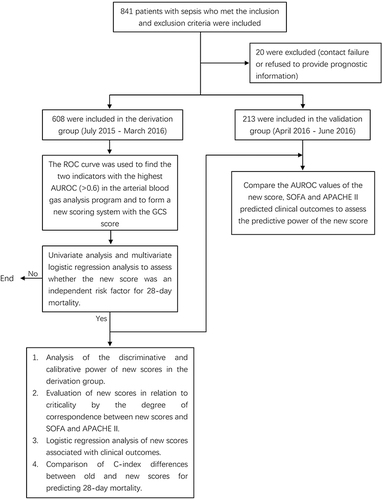
Table 1 Comparison of Base Information of Derivation and Validation Groups
Table 2 Weight and Score of Scoring Items in the New Scoring System (GOL)
Table 3 Relationship Between Clinical Characteristics and GOL Scores of Patients with Sepsis in the Derivation Group
Table 4 Univariate Analysis and Multivariate Logistic Regression Analysis Between Survival and Death Groups in the Derivation Group
Figure 2 ROC curves of GOL, SOFA and APACHE II in the derivative group.
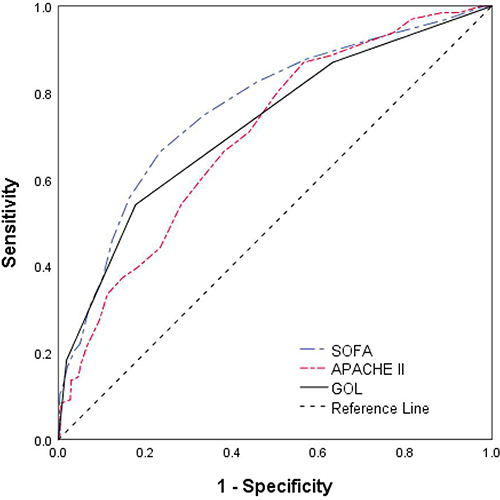
Figure 3 SOFA (A) and APACHE II (B) levels in different OLG scores.
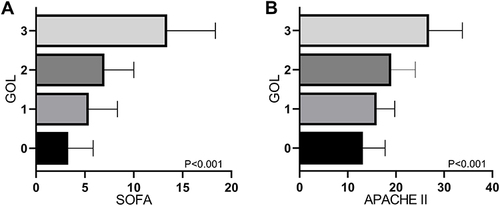
Figure 4 The 28-day mortality (A), MV (B), and AICU (C) with different OLG scores.
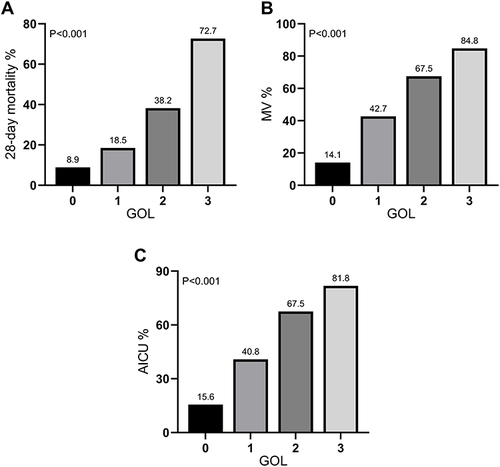
Table 5 Logistic Regression Analysis Regarding Correlations Between Clinical Outcomes and GOL
Figure 5 Decision curve analysis for the outcome of 28-day mortality. For clinically relevant threshold probabilities (above 18% and 43%), OLG was superior to APACHE II and SOFA, respectively.
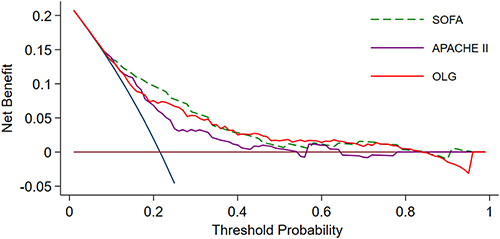
Table 6 AUC Comparison of Adverse Outcome Prediction Based on GOL, APACHE II, and SOFA in Validation Cohort